Introduction
of ECAL Data Compression
Why
we need the reduction of ECAL data size of CMS ?
The
electromagnetic calorimeter(ECAL) of the CMS detector consists of 82,728
lead tungstate crystals. The electrons or photons are stopped in this material
which represents 25.8 radiation lengths, emitting lights that are collected
by the avalanche photo-diodes(APDs) in the case of barrel, and by the vacuum
triodes in the case of endcap. The observed energy may vary from below
1 GeV up to 1 TeV. After the digitization, the measured energies are converted
to 12 + 2 bit words. The energy itself is digitized to 12 bits, and the
2 extra bits are used to represent the scale factor corresponding to the
amplifier that has not been saturated and that has the highest gain. This
technique of dynamic range compression is implemented in the
Floating-Point Pre-Amplifier(FPPA)
The
collisions between the oppositely circulating proton beams at the LHC take
place at a rate of 40 MHz. The level 1 trigger rate is supposed to be 100
kHz. Taking this L1 trigger rate into account and considering the number
of crystals in the ECAL as well as the size of the signal and the number
of samplings per signal, we may calculate the amount of information produced
by the ECAL which has to be processed by the Upper
Level Readout( ULR).
This amounts to 1,328 Gigabits per second, which is much higher than the
allowed value for the entire CMS event builder, i.e., 500 Gigabits per
second. Therefore, the complete readout and storage of the signals from
all these crystals are not possible. Only 100 kilobytes are allocated to
the ECAL data per event, and we need to find a way to reduce the data to
this level.
How
to reduce this volume ?
One
way of solving this problem of large data handling is to neglect small
signals below a certain threshold. This is called 'zero
suppression'. This method allows to remove
a significant fraction of the full ECAL data which are within u1
s
around the pedestal values in the crystals where practically no energy
has been deposited. On the other hand, when some crystals receive the electrons
or photons of sufficiently large energy, we would want to keep the entire
information without zero suppression so that we may reconstruct in full
detail the physical processes occurring in that region. A compromise between
the zero suppression and the full readout has been proposed to reduce the
data size to an acceptable level[1][2]. Application of this
Selective Readout(SR) algorithms results in
the data sizes of the order of 100 kilobytes, which may be within the data
acquisition requirement. The average data size, however, depends on the
cuts that are used in the selective readout algorithms. Therefore it is
necessary to consider the possibility of further reducing the data size
so that the optimization of the cuts can be performed. The compression
can be done in two different ways, say, by lossy
and lossless methods. As we want to keep the
information as precisely as possible for the selected data, we will limit
ourselves to the lossless ones. The coding methods like the differential
coding, the entropy coding, the dynamic coding, the residual parametric
coding, and the run length coding fall into
this category[3][4][5][6].
The selective readout, hereafter called SR, may reduce the data size,
without too much loss of physical information,
at a level allowed by DAQ by identifying the regions in space which contain
significant energy.
Two types of SR have been developed and their
physical and instrumental aspects have been studied thoroughly in the
past[2]. One of these is called the tower SR. It is based
on the readout of crystal
signals in the trigger towers containing a trigger tower which has an
energy sum exceeding 1.0 GeV, for instance.
The other algorithm called single crystal
SR generates the readout information based on the energy of
each crystal.
In this sudy, we concentrate on the tower SR which is more likely to
be adopted in the CMS readout system than the other.
Two possibilities are considered :
One(SR1) is the use of two different domains, say, time
domain and space domain, according to the size of the transverse
energy measured in the trigger towers. If the
transverse energy of the tower sum exceeds 2.5 GeV, full ten samplings
in time are read out(time domain). For tower energies between 1.0 GeV
and 2.5 GeV, only the filtered energy of each crystal is read out
instead of the full time samplings(space domain). This method has the
advantage of reducing the data size considerably, and it is not
difficult to make the size smaller by a factor of 50, below the size
allowed by the data acquisition system.
The other method(SR2) has only one cut in the transverse energy, say, at
1.0 GeV, and it records the full time samplings. In this case, the data size
may become so large that a further data compression stage is needed
before they are sent to the DAQ. The availability of many compression
algorithms that have already been developed
allows this option to be studied in detail. Therefore, we will try to
estimate the data size in the case of the full readout for various cut
values of the transverse energy.
In
order to test the performances of the compression techniques that will
be described in the following sections, we generated fully simulated ECAL
data. The full simulation of signal and background events have been done
by the CMSIM version 115, with some modification and addition of subroutines
when necessary.
First, we incorporated a proposed ECAL endcap trigger tower
geometry[7]. The outermost endcap towers overlapping with the last barrel
trigger tower are not used. Fig.1 shows the way the crystals are configured
in a quarter of the endcap. The mixed energy scale suggested in
ref.[1]
is taken into account. In the barrel, the minimum value of LSB is chosen
to be 20 MeV, at h=0.
The LSB in energy follows sin-1
q distribution,
whereas it stays constant in the transverse energy scale. In the endcaps,
the LSB in energy is fixed, instead. The variation of electronics
noise level which has a similar behaviour is set by default in the CMSIM
code, as can be seen in Fig.2(a)-(b). However, we made a modification of
the ecal.tz file to remove the zero suppression which is applied at 1s
by default. Also, the noise is generated independently for each time sampling.
The pedestals are set to 25 ADC counts, which corresponds to 500 MeV at
h=0.
In Fig.3(a)-(d) we plotted the distribution of the crystal energies, the
ADC counts, the ADC counts in the barrel only, and the ADC counts in the
endcaps only, respectively, for all the sampling values of an event without
any signal, i.e., only with noise. The noise levels are set at Et=30
MeV and E=150 MeV in the barrel and in the endcaps, respectively.
The modeling of the signal is done using the formula proposed in ref.[8], which reads

,
where a
=1.5, b-1=0.568,
and tof represents the time of flight of the hit. The
QCD events with the transverse momentum above 100 GeV/c and the minimum
bias events have been generated. On top of each QCD event, 20 minimuim
bias events have been piled-up. This corresponds to the luminosity of 1034cm-2
s-1, approximately. The pile-up of events coming
from the interactions of the bunch crossing at different times has not
been included assuming that the starting time of the shower which gives
rise to the signal measured at a given time can be known in some way. (This
can be achieved by a filter that determines both the jitter and the size
of the signal from each crystal) Fig.4(a)-(d) represent the crystal energy,
Et, in the barrel, and the crystal energy in the two endcaps,
respectively, for a Higgs event with four electrons in the final state.
In the barrel, the crystals are grouped into 5 by 5 matrices. The position
of a matrix is represented by two indices Ihand
If.
The ranges of Ihand
If
are given by 12-45 and 1-72, respectively. The geometry of endcaps requires
a special indexing scheme. Following the most recent proposal, the Ih
takes on the values from 5 to 11, and from 46 to 52 for the forward and
backward endcaps, respectively. The distribution of Et in
the trigger towers for the same event is shown in Fig.5(a). Fig.5(b) shows
the positions in Ihand
If
plane of the towers that have recorded more than 1 GeV of transverse energy,
as well as the trigger towers adjacent to them.
The
generated QCD events have been used to estimate the occupancy of the towers
and the results are given in Table 1 for different SR criteria. Also shown
in Table 1 are the size of the events. In the case of the SR2, where all
ten time sampling are read out, four different cuts are considered; Et>2.5
GeV, Et>1.0 GeV, Et>0.5 GeV and
Et>0.3 GeV. The coarse grain data of about 4 kbytes needs to
be added to each of them. The ULR scheme of ref.[2] suggests that the crystals corresponding
to a supermodule are read out by one ULR crate, thereby necessitating 50
ULR crates in all. The compression of the ECAL data is supposed to be performed
in the Data Concentrator Card(DCC) which collects data from the ULR cards
and passes it to the DAQ system. Therefore, it is required that our simulated
events be splitted into different supermodules. We have thus produced the
event files corresponding to the 50 supermodules. The size of the data
obtained by applying the SR1 is well below 100 kilobytes which is allowed
by DAQ. In the case of SR1, it is required that the filtered energy of
the crystals be estimated with a good precision so that the physics of
interest in CMS is not affected significantly by keeping only the filtered
value instead of the full time sampling values. Also, the time needed for
calculation must be very short, say, less than the L1 trigger latency of
several microseconds. In the case of SR2, the increase of the data size
in lowering the threshold makes it necessary to consider a compression
of the data to a lower level that can be processed by DAQ.
| SR type |
no. of towres |
no. of crystals |
event size |
| SR1(time + space) |
68(262)
|
1,482(5,416)
|
41.2 kB
|
| SR2-1(time, Et>2.5 GeV) |
68
|
1,482
|
29.8 kB
|
| SR2-2(time, Et>1.0 GeV) |
330
|
6,898
|
138.9 kB
|
| SR2-3(time, Et>0.5 GeV) |
908
|
936
|
381.4 kB
|
| SR2-4(time, Et>0.3 GeV) |
1,554
|
32,935
|
662.8 kB
|
Table
1. Occupancies
of the towers and the crystals. Two types of the selective readout are
compared. In the case of SR1, the values in the parentheses correspond
to the space domain data. In the case of SR2, where the space domain is
not used, three different cuts on Et are considered. An event is composed
of a high-Pt QCD event piled-up with 20 minimum bias events. One hundred
of such events have been used. The coarse grain data of about 4 kbytes
needs to be added to each of them
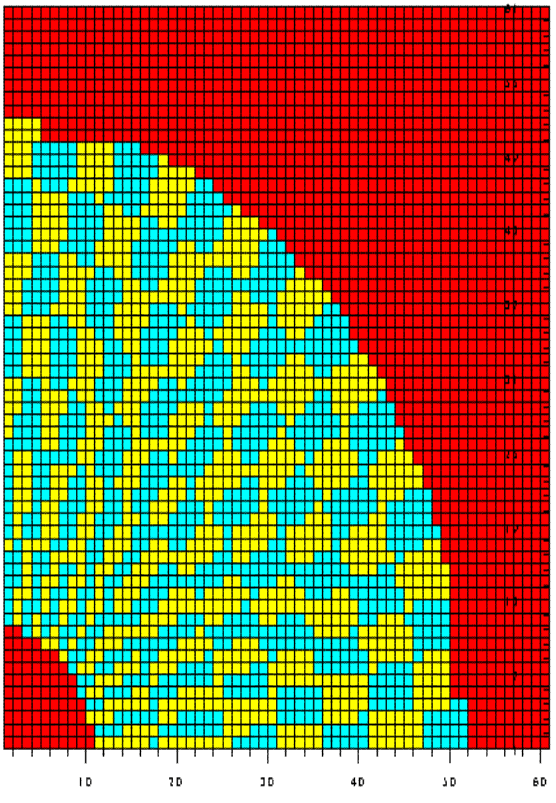 Fig 1. ECAL endcap trigger tower geometry
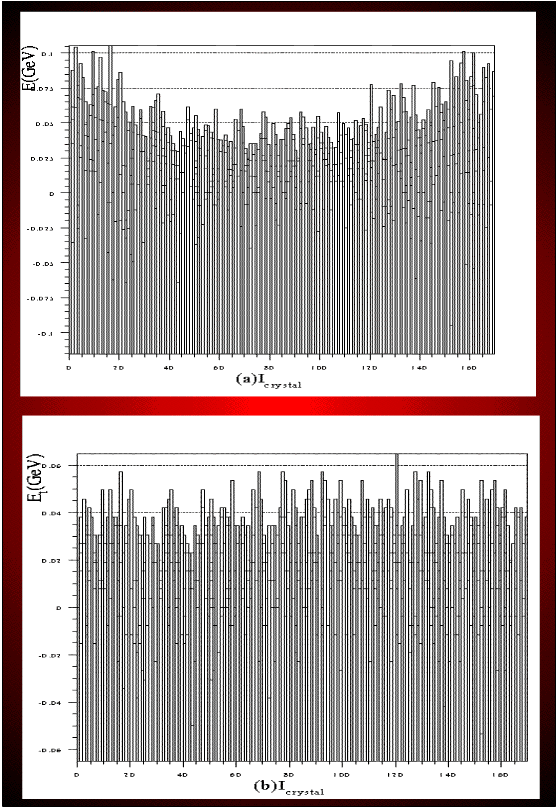 Fig 2.(a)Noise level in E for barrel vs h (b) Noise level in Et for endcap vs h
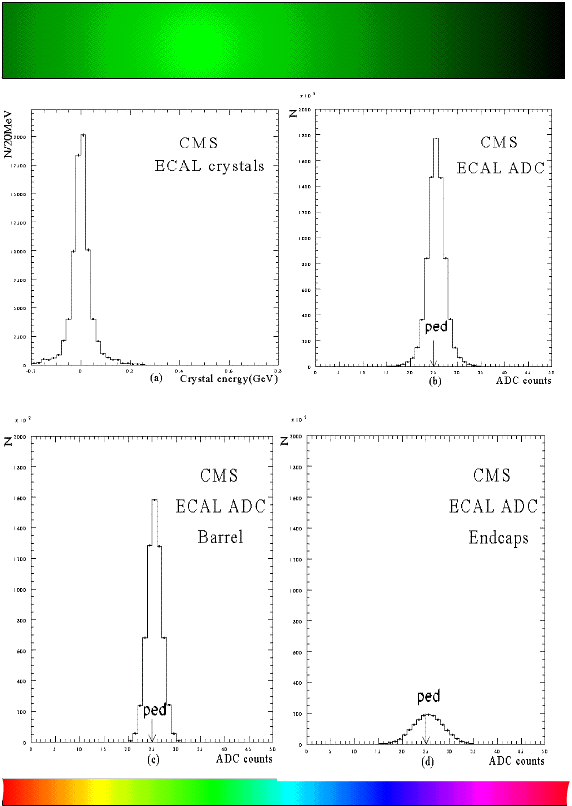 Fig 3.(a)Distribution of the crystal energy (b)The
ADC counts (c)The ADC counts in the barrel, and (d)The ADC counts in the
endcaps, for all the samplings in an event containing no signal
Fig 3.(a)Distribution of the crystal energy (b)The
ADC counts (c)The ADC counts in the barrel, and (d)The ADC counts in the
endcaps, for all the samplings in an event containing no signal
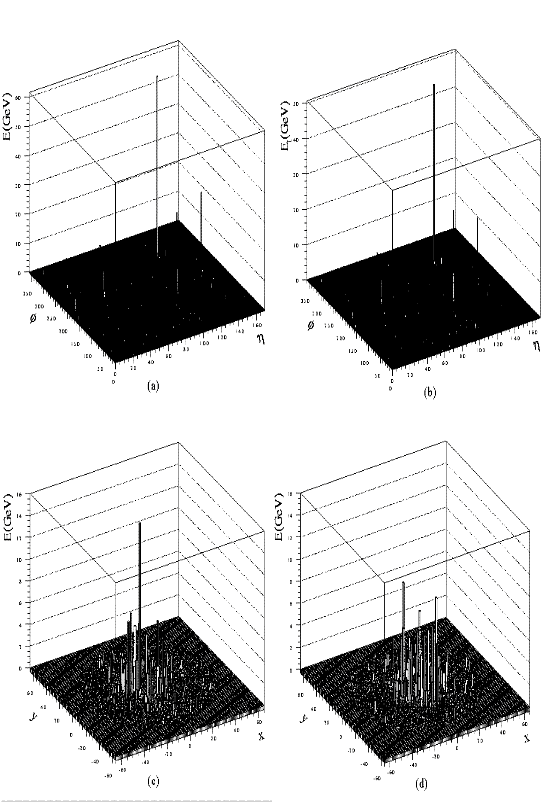 Fig 4.(a)The crystal energy in the barrel (b)the
crystal Et in the barrel (c) The crystal energy in the
forwatrd endcap and (d)the crystal energy in the backward endcap. A
Higgs particle of 150 GeV/c2 decays into four electrons
Fig 4.(a)The crystal energy in the barrel (b)the
crystal Et in the barrel (c) The crystal energy in the
forwatrd endcap and (d)the crystal energy in the backward endcap. A
Higgs particle of 150 GeV/c2 decays into four electrons

Fig 5. (a) The Et distribution of the
trigger towers for the Higgs events (b)The positions in Ih vs IF plane of the towers that have recorded more than
1 GeV of transverse energy, as well as the adjacent trigger towers. The
gray cells correspond to the time domain and the brigther cells
represent the space domain
What is lossless data compression ?
In general, the method of data compression could be
divided into two groups, lossless and lossy compression. the method of lossless
compression allows to reduce the data size without losing any information.
This method is used in making ZIP and GIF files.
These differs from the files offered by the
method of lossy compression,which loses some
information as the JPEG files.
Why we use lossless data compression ?
Whenever we have the problem of space but we don't want
to loss any information, we can use losseless compression method. In case of CMS
experiment, we propose to take lossless compression in time domain because it allows
to reconstruct the original frame. This reconstruction allows to process the time frame with sophisticated offline methods (jitter correction, pile-up study)
Algorithms for the lossless compression and Estimation of the compression factors
we introduce five types of data compression algorithms
which are most commonly used in the communication systems or in
archiving the data files of the computers. We apply these methods to the
ECAL data and evaluate the corresponding compression factors.
There is list of lossless compression methods we have studieds.
| Family
|
Variations
|
| Differential coding
|
DPCM (Differential Pulse Code Modulation)
PDPCM (Predictive
Differential Pulse Code Modulation)
|
| Entropy coding
|
Huffman coding with fixed table
Huffman coding with variable table
|
| Transformation coding
|
Wevelet coding
DCT(Discrete
Cosine Tansformation) coding
|
| Dynamic coding
|
None
|
| Residual parametric coding
|
None
|
| Run-Length coding
|
Mixed coding with Run-Length and 8 bits coding
|
| Dictionary method
|
ALDC(Adaptive Lossless Data Compression)
DCLZ(Data Compression Lempel-Ziv)
|
Differential coding
The signal from a given crystal is shaped by
the preamplifier so that a decaying time of about 300
ns is introduced.
A sampling is performed every 25 ns and the measured voltage
is digitized by a 12-bit ADC after passing through the floating point
unit(FPU) which determines the dynamic range of the output
signal. Fig.1(a) shows the typical shape of the signal and the points of
samplings in unit of 25 ns. The hights of the signal at
the sampling points are recorded.
Another possible way of keeping the same amount of information is to record
the value at the first sampling point and then to record the difference
between the first and the second, between the second and the third, and so
on. This method is called the differential coding. The advantage of
such a coding scheme is that the numbers to record are usually smaller
than the standard coding, and the number of bits needed to record the
numbers may be smaller even though we need to introduce one more bit
that represent the sign of the differences which can be
negative. Fig.1(b) shows the differences between two neighboring samples.
This simple method allows us to reduce the length of the
data, especially if the signal varies slowly with
respect to the sampling interval. In our case, however, the rise and
fall of the signal is so fast that no signaificant gain in the data
length may be expected. Nevertheless, it will be instructive to do an
exercise and estimate the compression rate using the data of Fig.1.
The number of bits needed to code the sampled value x(i)is given by
Int(log2(x(i))+1),whereas the difference between the neighboring
samples d(i) = x(i) - x(i+1) can be coded by
Int(log2(abs(d(i)+0.5)+1)+1)+1 bits. These numbers of bits
corresponding to the 14 sampling values and also to the differences
are given in Table 1. The maximum number of bits in the two
cases are 12 and 11, respectively, and no significant gain is achieved
by applying this algorithm.
| Samplings
|
1
|
2
|
3
|
4
|
5
|
6
|
7
|
8
|
9
|
10
|
11
|
12
|
13
|
14
|
|
Normal coding
|
7
|
11
|
11
|
11
|
12
|
11
|
11
|
11
|
10
|
10
|
9
|
8
|
8
|
7
|
|
Differencial coding
|
11
|
11
|
9
|
7
|
9
|
10
|
10
|
10
|
10
|
9
|
9
|
8
|
8
|
-
|
Table 1:Number of bits needed to record the differences between
the neighboring sample values
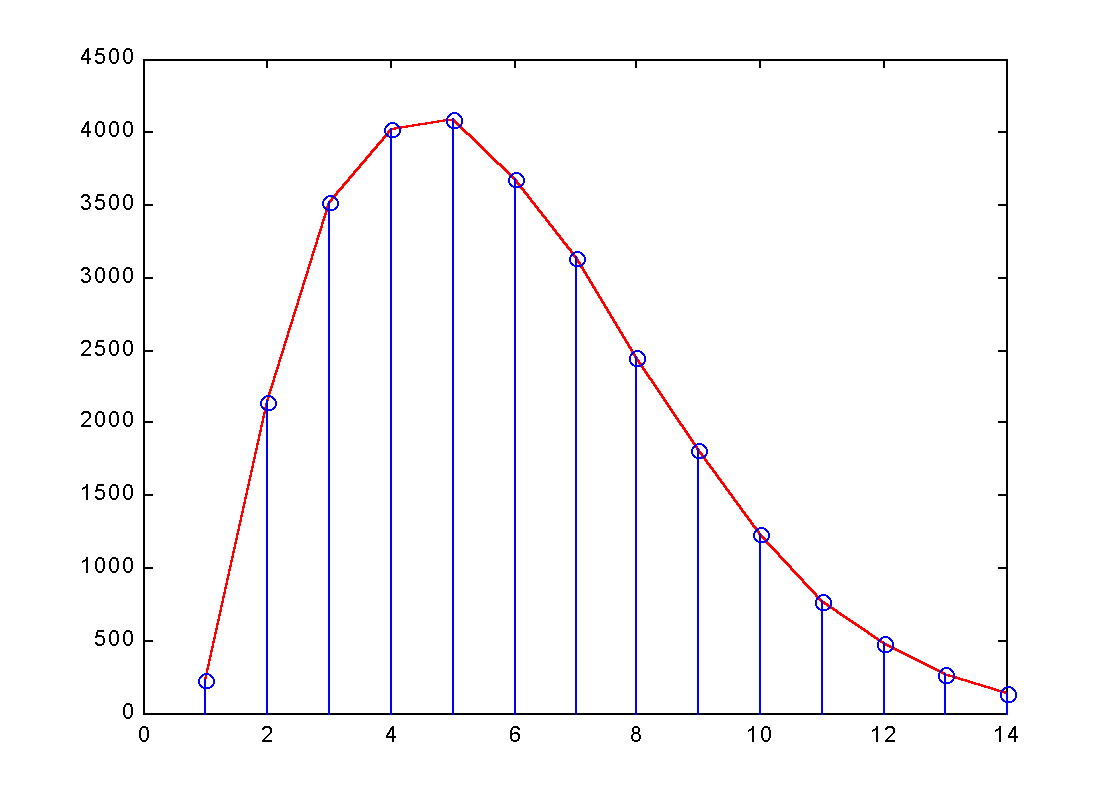
Fig.1(a) Differential coding: Shape of the signal vs. time
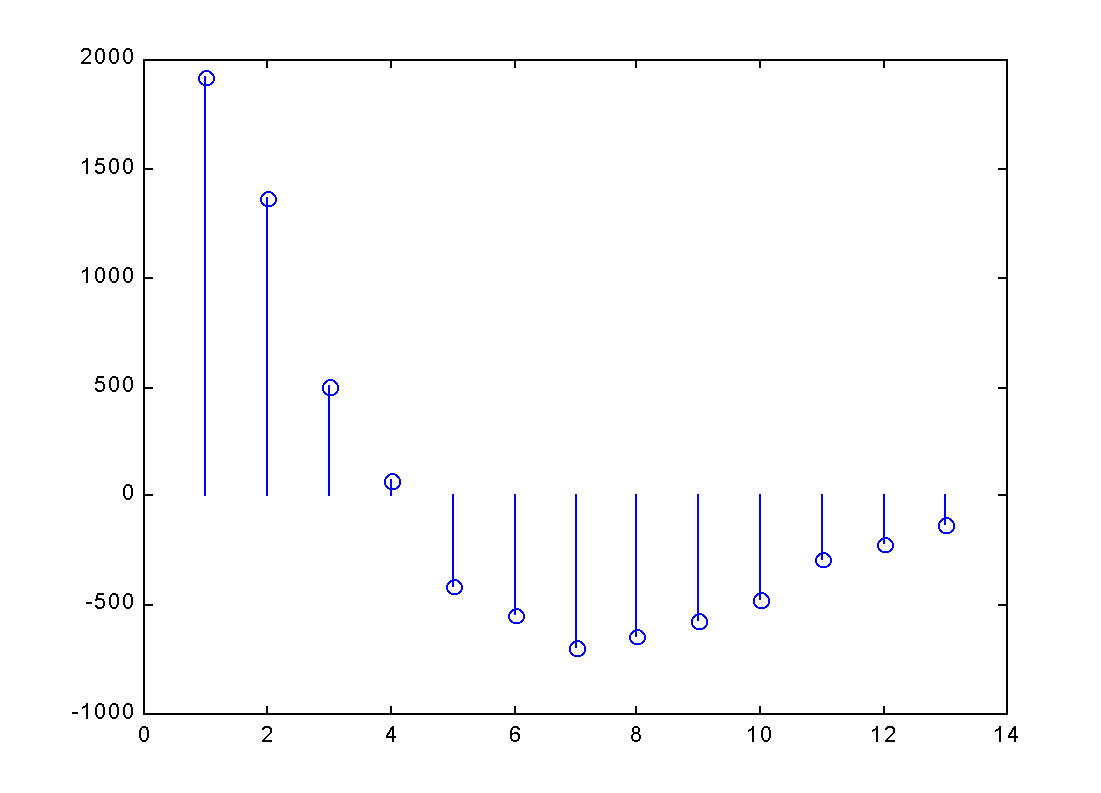
Fig.1(b) Differences between neighboring samples
Residual parametric coding :
If the shape of the signal has a time dependence that can be
approximated by a simple function of time, and if the difference
between the signal and the function is small in most of the cases, we
may reduce the data size by coding the differences. To apply this
algorithm called residual parametric coding, we proceed as follows :
(1) Generate a model as shown in Fig.2(a)
(2) Normalize the model to the signal so that the maxima of the
two
have the same magnitudes. See Fig.2(b)
(3) Calculate the differences between the signal and the model
at the
sampling points.
(4) Make the data file of the following structure.
Here, the header represents the maximum bit length, Nb, of the
difference values. The header is followed by the value of the signal at its
maximum, and then by the difference values having Nb bits
each. Using the data and the model function shown in Fig1(c) and
Fig1(d), we obtain the Table 2. As we have 16 samples of 12 bits, the
initial length is 192 bits. With this residual parametric coding, only
106(4+12+15*6) bits are needed, giving a compression factor
of 1.79.
| Samplings
|
1
|
2
|
3
|
4
|
5
|
6
|
7
|
8
|
9
|
10
|
11
|
12
|
13
|
14
|
15
|
|
Normal coding
|
12
|
12
|
12
|
12
|
12
|
12
|
12
|
12
|
12
|
12
|
12
|
12
|
12
|
12
|
12
|
|
R.P.C.
|
2
|
4
|
4
|
5
|
6
|
5
|
3
|
5
|
1
|
6
|
3
|
3
|
5
|
5
|
5
|
Table 2: Number of bits needed to record the differences between
the signal and the model
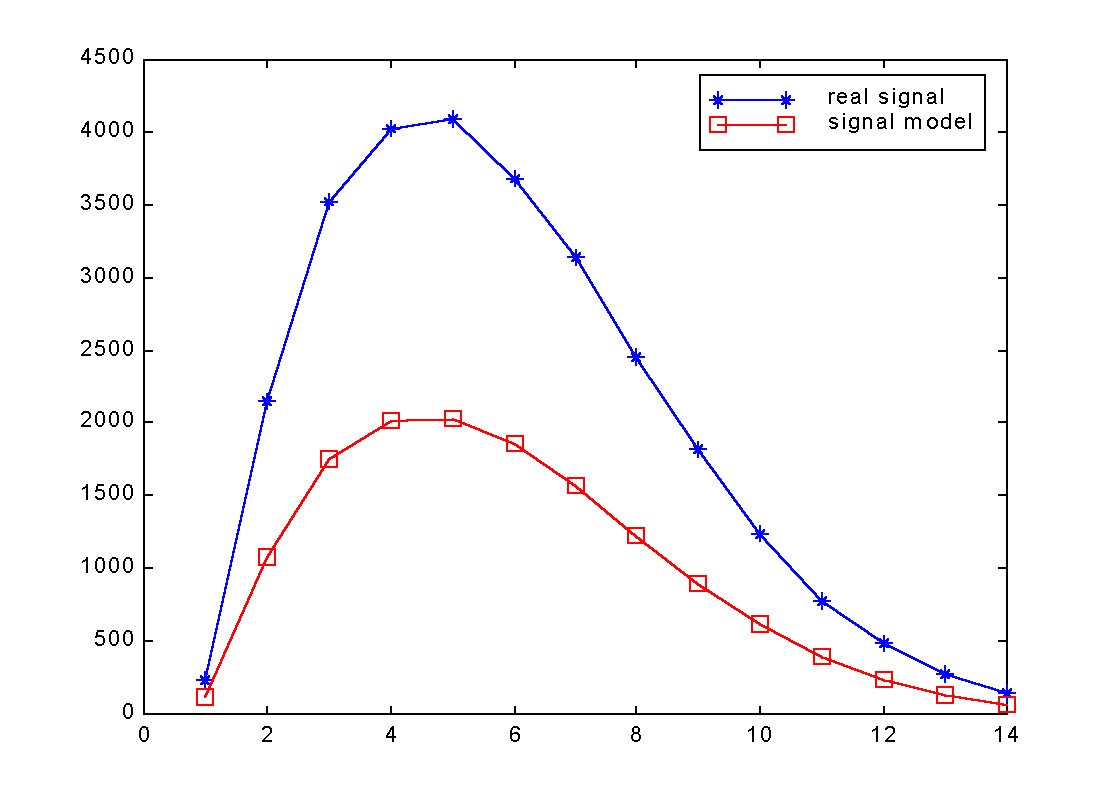
Fig.2(a) Residual parametric coding: Signal and Model before
normalization
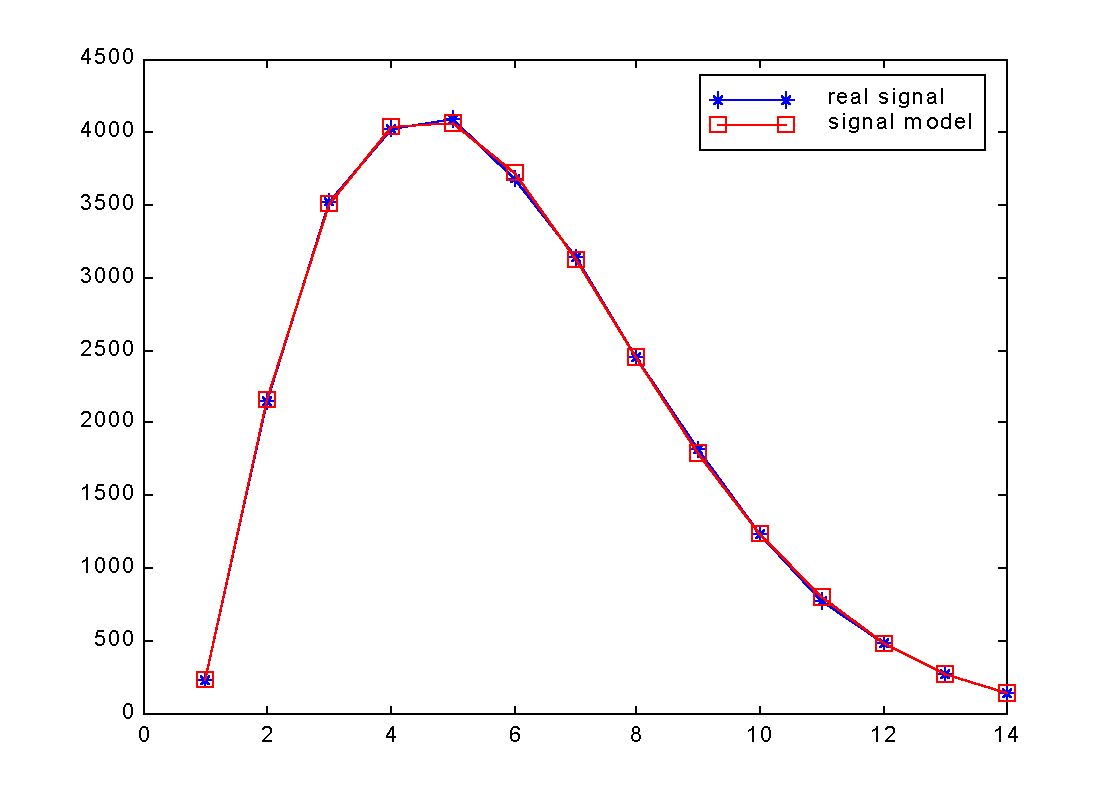
Fig.2(b):Signal and Model after normalization
Huffman coding :
When the same numbers appear repeatedly, we may
replace these numbers with some other numbers having shorter number of
bits. The best reduction of the total length of a set of numbers can
be obtained by associating more frequently apprearing numbers to
shorter numbers. Huffman's coding method gives the optimized
assignment rule which is uniquely decodable.~\cite{Huffman}
We take an example of Huffman coding to illustrate
this method. Let us consider a set of 6 numbers Ai, (
i =1,.. 6) occurring with the probabilities 0.4, 0.3, 0.1, 0.1, 0.06,
0.04, respectively. The corresponding Huffman codes are given in
Table3.
|
Number
|
Probability
|
Code
|
|
A1
|
0.4
|
1
|
|
A2
|
0.3
|
00
|
|
A3
|
0.1
|
011
|
|
A4
|
0.1
|
0100
|
|
A5
|
0.06
|
01010
|
|
A6
|
0.04
|
01011
|
Table 3:An example of Huffman code assignment
The average length of this code is
0.4 X 1 + 0.3 X 2 + 0.1 X 3 + 0.1 X 4 + 0.06 X
5 + 0.04 X 5 = 2.2 bits/number whereis the fixed length coding
requires at least 3 bits for each number. Once the code is fixed, the
coding and decoding are done in a unique way. The numbers are written in
a form of a block code. For example, the sting 01000101001100 is
unambiguously decoded as A4 A5 A3 A2.
To apply the Huffman coding method to the ECAL data,
we used the distribution of the
ADC counts shown in Fig.3(a). The shortest Huffman code is associated
to the most frequently occurring value IP. To the ADC values from IP-7 to
IP+7 are assigned the codes with its length varying from 2 to 9 bits.
For the values
smaller than IP-7, a 9+8 bits structure is used, where the Huffman
code of 9 bits is followed by the 8 lowest bits of the ADC. For
the values larger than IP+7, a 4+16 bits structure is used, making use
of the full 16 bits of the ADC. The resulting Huffman code assignment is
given in Table 4.
|
ADC Counts
|
Probability
|
Code
|
Word length
|
|
IP-8 or smaller
|
0.19
|
101101000
|
9+8
|
|
IP-7
|
0.22
|
101101001
|
9
|
|
IP-6
|
0.42
|
10110101
|
8
|
|
IP-5
|
0.78
|
1010101
|
7
|
|
IP-4
|
1.72
|
101100
|
6
|
|
IP-3
|
4.42
|
10111
|
5
|
|
IP-2
|
10.10
|
001
|
3
|
|
IP-1
|
17.40
|
110
|
3
|
|
IP
|
21.05
|
01
|
2
|
|
IP+1
|
17.69
|
111
|
3
|
|
IP+2
|
10.74
|
100
|
3
|
|
IP+3
|
5.19
|
0001
|
4
|
|
IP+4
|
2.53
|
10100
|
5
|
|
IP+5
|
1.46
|
101011
|
6
|
|
IP+6
|
0.95
|
1011011
|
7
|
|
IP+7
|
0.67
|
1010100
|
7
|
|
IP+8 or larger
|
4.46
|
0000
|
4+16
|
Table 4: Huffman code assignment for the ECAL ADC values, Here IP
respresents the ADC value corresponding to the pedestal, which is 25
in this case
Table 5 shows the performance of the Huffman coding
for the 100 hard QCD events with five different SR types.
A good performance of compression is obtained with this $truncated$
Huffman method. Also shown in the same table is the compression
factors obtained by applying the unix command $compact$ that uses an
adaptive Huffman code.
| SR type
|
event size
|
Huffman coding
|
compact
|
|
SR1(time+space)
|
41.2 kB
|
10.4 kB(4.1)
|
13.7 kB(3.0)
|
|
SR2-1(time, Et>2.5 GeV)
|
29.8 kB
|
7.6 kB(3.9)
|
9.5 kB(3.1)
|
|
SR2-2(time, Et>1.0 GeV)
|
138.9 kB |
33.0 kB(4.2)
|
49.0kB(2.83)
|
|
SR2-3(time, Et>0.5 GeV)
| 381.4 kB |
87.0 kB(4.3)
|
129.2.0kB(2.9)
|
|
SR2-4(time, Et>0.3 GeV)
| 662.8 kB
|
148.0 kB(4.4)
|
221.0 kB(2.9)
|
Table 5: The event sizes with and without Huffman
coding. Results with the Truncated Huffman coding using a fixed
table and the Adaptive Huffman coding with a variable table are shown.
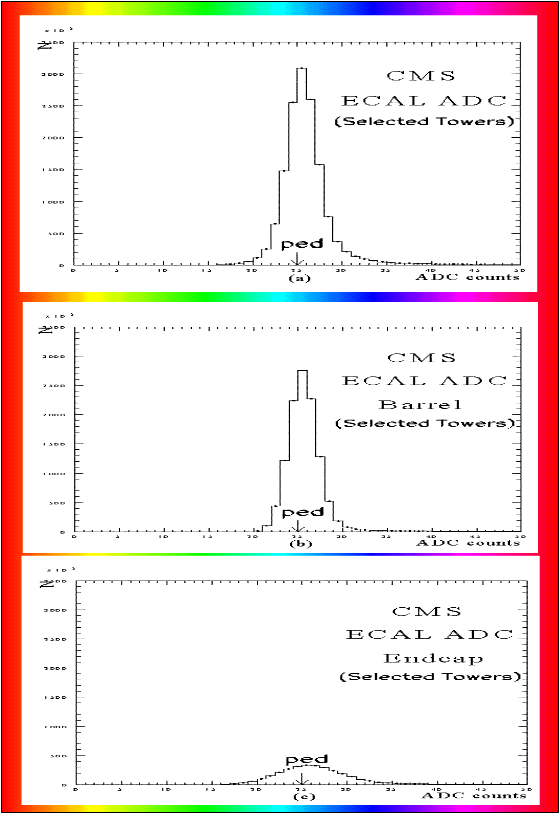 Fig 3.(a)Distribution of the ADC counts used to
generate the Huffman codes (b) Same distribution with barrel (c)Same
distribution with endcaps
Fig 3.(a)Distribution of the ADC counts used to
generate the Huffman codes (b) Same distribution with barrel (c)Same
distribution with endcaps
Dictionary method:
The dictionary method uses the property of many data types that
contain repeating code sequences. It can be divided into two main
groups which are based on the algorithm developed and published by
A. Lempel and J. Ziv[10].
The point of the first group is to try to find
if the character sequence currently being compressed has already
occurred earlier in the input data. In the case the same sequence is
found, instead of repeating it, the algorithm outputs a
pointer. See Fig.4(a).The second group creates a dictionary of the
phrases that occur in the input data. When they encounter a phrase
already present in the dictionary, they just output the index number
of the phrase in the dictionary as shown in Fig.4(b).
In most of the unix machines, the commands compress
and gzip
performs the compression using the dictionary method. Therefore, we
have evaluated the compression rates using the simulated ECAL data in
the two cases. The results that we obtain for different SR criteria
are summarized in Table 6.
| SR type
|
event size
|
compress
|
gzip
|
|
SR1(time+space)
|
41.2 kB
|
11.6 kB(3.5)
|
12.0 kB(3.4)
|
|
SR2-1(time, Et>2.5 GeV)
|
29.8 kB
|
8.0 kB(3.7)
|
8.3 kB(3.6)
|
|
SR2-2(time, Et>1.0 GeV)
|
138.9 kB |
38.9 kB(3.5)
|
41.50kB(3.3)
|
|
SR2-3(time, Et>0.5 GeV)
| 381.4 kB |
99.7 kB(3.8)
|
106.8.0kB(3.6)
|
|
SR2-4(time, Et>0.3 GeV)
| 662.8 kB
|
168.6 kB(3.9)
|
184.0 kB(3.6)
|
Table 6: The compression factors for the ECAL data using the
unix commands
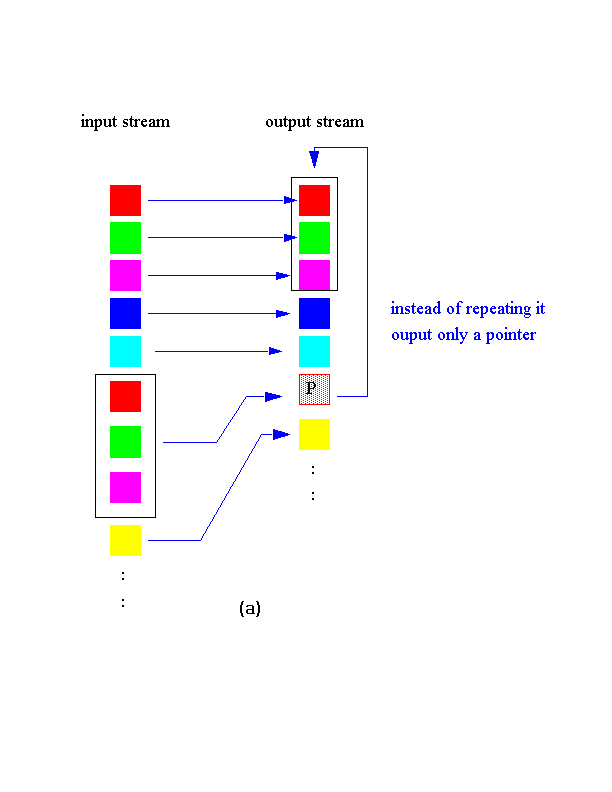
 Fig 4.Dictionary methods: (a)scheme 1 and
(b)scheme
2
Fig 4.Dictionary methods: (a)scheme 1 and
(b)scheme
2
Dynamic coding :
It was suggested by Busson et al[11] that a reduction of the
data size can be done by simply choosing the word length between one
byte and two bytes. In this dynamic coding scheme, the first one or
two bits of the 8 bits is used to indicate the length of the
signal from each crystal. A slightly modified data structure is
described in the following.
The energies of the 25 crystals in a given trigger tower are stored in
consecutive. The 10 values corresponding the ten time samplings for
the first crystal are
written first, followed by the 10 time samplings of the next crystal,
etc. By allocating
one byte(eight bits) to each energy value, a minimum of 250 bytes are
needed to record all the energy values. If a crystal has an energy
exceeding the maximum that can be represented by the eight bit, one
more byte or two is used. The number of crystals that need two or
three bytes and their sequential number are also coded in the data
train. These numbers can be represented by a one byte.
We suggest the data structure as described below.
(1) In the first byte, the first bit(MSB) is used to specify the data
type: either full ten time samplings or the filtered value. The next
bit is reserved as the flag of the presence of very large signal
which needs 3 bytes.
The remaining 6 bits are used to assign the position in Eta of the
corresponding trigger tower which varies from 1 to 56.
(2) The first bit of the next byte indicates the presence of the 2-
byte data, and the following seven bits specify the position in phi
ranging from 1 to 72.
(3) In the case that 2-byte data are present,
the number of the crystals which recorded such signals
is written in the next byte. Let's call it N2 (N2 =0,..250).
This byte can be followed by another byte, which is, N3,
if necessary.
(4) The sequential numbers of the crystals that need 2-byte record
occupy N2 bytes. Sometimes it can be followed by N3
addresses for crystals having very high energy deposit.
(5) Total of 250 + N2 + N3 * 2 bytes to record the ADC counts of
a trigger tower chosen by the SR.
In the case that we use the space domain data to get a better
reduction rate, we read the sum over ten samplings if the
transverse energies of a tower is between 1.0 GeV and 2.5 GeV.
The event sizes with and without dynamic coding are given in TableY1
for various SR parameters. About a factor of two
compression is obtained, as expected.
| SR type
|
event size
|
dynamic coding
|
compression factor
|
|
SR1(time+space)
|
41.2 kB
|
21.0 kB
|
1.9
|
|
SR2-1(time, Et>2.5 GeV)
|
29.8 kB
|
15.0 kB
|
1.9
|
|
SR2-2(time, Et>1.0 GeV)
|
138.9 kB |
69.8 kB
|
1.9
|
|
SR2-3(time, Et>0.5 GeV)
| 381.4 kB |
191.7
|
1.9
|
|
SR2-4(time, Et>0.3 GeV)
| 662.8 kB
|
333.0
|
1.9
|
Table 7:The event sizes with and without dynamic coding.
Some commercial devices that perfom the compression of data are found
to be available in the form of integrated circuits. The evaluation
softwares for those products have been used to see the possibility of
using such devices in our case.
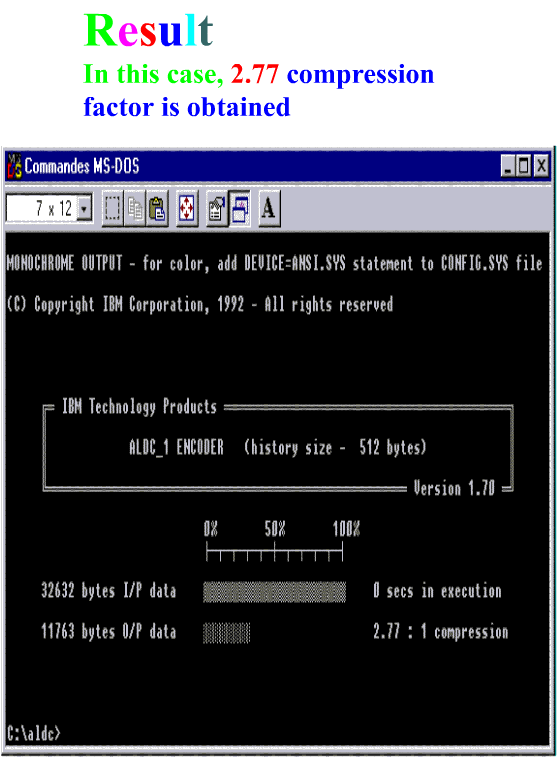
ALDC
First, we considered the Adaptive
Lossless Data Compression(ALDC), which is running in an IBM product
ALDC1-40S-M[12]. We ran the ALDC software on the data files
generated with and without dynamic coding.
Table 1 shows the
compression factors.
In order to check that the ALDC algorithm is efficient when applied to
a single 3 by 3 tower array, we have generated a single electron with
different h and in Pt values and passed them through the full detector
simulation. The original and the compressed data sizes are given in
Table 1. The compression factor remains to be more than 2 in almost
all cases. The variaion of the compression factor in h and Pt
is consistent with our expectation taking into account the noise level
in barrel and in endcaps, and the size of the electromagnetic shower.
| SR type
|
event size
|
size with ALDC
|
compression factor
|
|
SR1(time+space)
|
41.2(21.0) kB
|
15.6(11.8) kB
|
2.6(1.7)
|
|
SR2-1(time, Et>2.5 GeV)
|
29.8(15.0) kB
|
11.7(8.5) kB
|
2.6(1.7)
|
|
SR2-2(time, Et>1.0 GeV)
|
138.9(69.8) kB |
53.1(40.4) kB
|
2.6(1.7)
|
|
SR2-3(time, Et>0.5 GeV)
| 381.4(191.7) kB |
139.4(109.5) kB
|
2.6(1.7)
|
|
SR2-4(time, Et>0.3 GeV)
| 662.8 (333.0)kB
|
245.1(189.9) kB
|
2.7(1.8)
|
Table 1: The data size before and after applying the ALDC algorithm and the
compression ratios with various Et thresholds.
The values in parentheses correspond to the dynamically coded data

Start


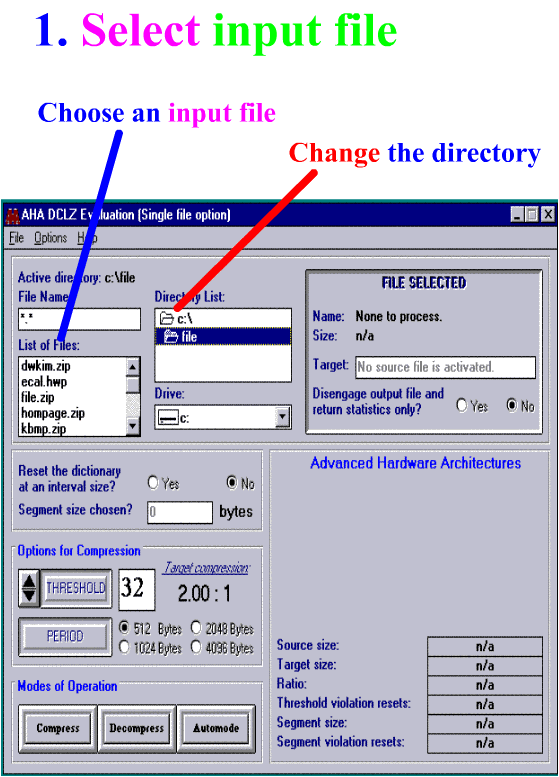
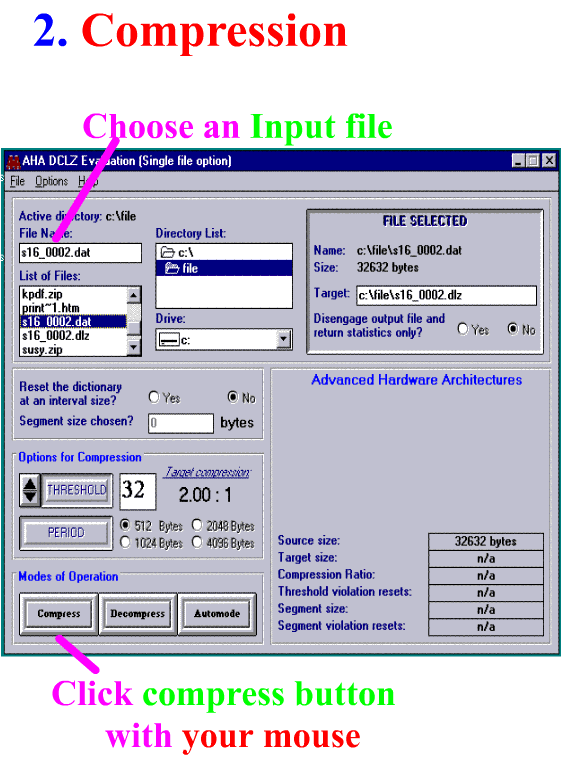
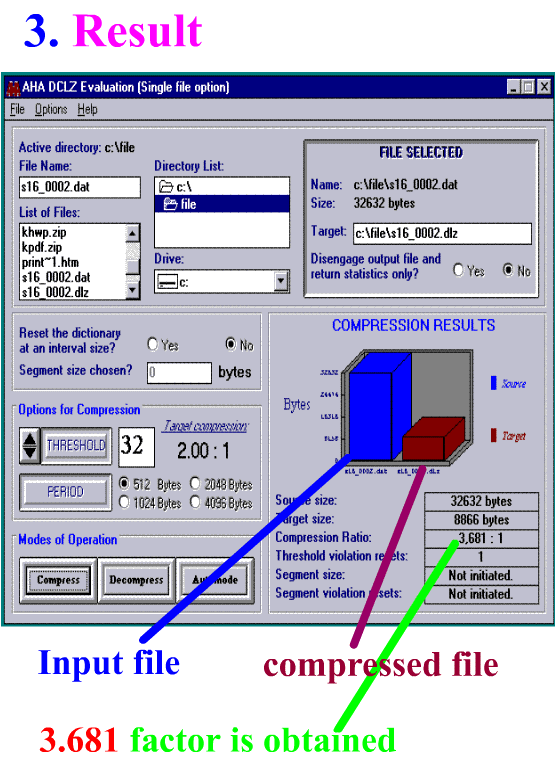
DCLZ
Another device that we found in the market is called
Data Compression Lempel Ziv(DCLZ)[13]. Similar
checks have been done with the software, and the results are given in
Table DCLZ.
| SR type
|
event size
|
size with DCLZ
|
compression factor
|
|
SR1(time+space)
|
41.2(21.0) kB
|
21.1(10.9) kB
|
3.3(1.9)
|
|
SR2-1(time, Et>2.5 GeV)
|
29.8 (15.0) kB
|
8.8(7.6) kB
|
3.4(2.0)
|
|
SR2-2(time, Et>1.0 GeV)
|
138.9(69.8) kB |
42.1(34.6) kB
|
3.3(2.0)
|
|
SR2-3(time, Et>0.5 GeV)
| 381.4(191.7) kB |
110.6(90.8) kB
|
3.4(2.1)
|
|
SR2-4(time, Et>0.3 GeV)
| 662.8 (333.0)kB
|
193.6(155.7) kB
|
3.4(2.1)
|
Table 2: The data size before and after applying the DCLZ algorithm and the
compression ratios with various Et thresholds.
The values in parentheses correspond to the dynamically coded data.
Start
DSP
we purchased the TMS320c50 DSP card produced by Texas
Instrumentto applicate
lossless data compression
algorithms in Hardwares. Its cycle time and Package type is 50/35 ns and 132 pin ceramic.
You can see our results of testing this DSP card applicating DPCM
coding and Residual Parametric coding here .
Bibliography
[1] R. Benetta et al., ECAL Data Volume, CMS note
1997/059.
[2] J.C. Silva et al., CMS ECAL Data Concentrator-System
Design Description, CMS note 1999/012.
[3] P. Plume, Compression des donnees, Eyrolles, 1993
[4] J.A. Storer, Data Compression Methods and Theory,
Computer Science Press, 1988
[5] IBM J. Res. Develop. Vol.42 No.6, November, 1998
[6] D. Salomon, Data Compression, The complete reference,
Springer (1998)
[7] W. Badgett, Trigger Tower Definition Issues, Presented in
the TriDAS Meeting of June 16, 1998.
[8] Ph. Busson, Amplitude and time measurement of ECAL
signals with optimum digital signal processing, presented in the CMS
ECAL readout meeting of May 25, 1998.
[9] R.C. Gonzalez and R.E. Woods, Digital Image
Processing, Addison Wesley (1993)
[10] J. Ziv and A. Lempel, A Universal Algoritm for
Sequential Data Compression, IEEE Trans. Info. Theory IT-23. No.
3. (1997) 337-343
[11] Ph. Busson, A. Karar, and G.B. Kim, Study of ECAL data
compression, presented in the CMS ECAL readout meeting of May 6, 1998.
[12] ALDC1-40S-M Data Sheet Manual, IBM Document
Number : DCAL40DSU-02, November 2, 1994.
[13] For further informations, see http://www.aha.com
 Compression Pointers
Compression FAQ
Data compression for the
KLOE experiment
Frequently Asked
Questions