gtgrb Tutorial: LAT GRBanalysis
On this page: Also see:
Useful Reference: |
Note: This page has been updated, and now assumes that you are working with an SCons build of the ScienceTools.
Steps 20-24 at the very end of this tutorial pertain to performing an XSPEC analysis. Due to a programming glitch, XSPEC steps no longer works in gtgrb v2r3. Steps 33-34 of this tutorial were written when running an earlier version of software and are included in this text for reference only. This problem has been fixed in the HEAD version, and the fix will be incorporated in the next release, at which time this tutorial will again be updated.
Designed to provide a common environment for all the scripts, gtgrb is an interactive analysis tool that uses ROOT, ScienceTools, and ftools, together with a python (preferably ipython) interface to peform a standard LAT GRB analysis that is unique for each burst. Once all of the classes are loaded into the ipython interface, they can be called via the command line.
Running at SLAC. While the gtgrb tool is set up to work using a SLAC account, it can also work on different hosts, including your Laptop. However, if it is run at SLAC, you don't have to modify anything (other than the released version of ScienceTools) to have gtgrb running. The interface with the astroserver makes the download of the files straight forward (gtgrb will get the file from the astroserver).
There are many scripts that run in this common gtgrb framework, including the GRB, LAT (Detector), and GRB (Detector) scripts, which encapsulate all of the needed quantities and share various parameters such as:
- File paths
- Ra, Dec, ROI, Tstart, and Tstop
A number of utilities are also available, including:
- latutils
- genutils
- plotter (pylab and/or ROOT)
- conversion of MET to date (and vice versa)
- conversion from root to fits (and vice versa)
- merging of FT1 and FT2 fits files
The gtgrb_slac script defines the following variables:
- DATA IN:
(e.g., /nfs/farm/g/glast/u33/omodei/DATA/FITS)
- DATA OUT:
(e.g., nfs/farm/g/glast/u33/omodei/DATA/GRBOUT)
- All LAT ft1 and ft2 files are expected to be in the DATA/FITS/LAT subdirectory.
- The GBM file is expected to be in the DATA GBM subdirectory
(e.g., /nfs/farm/g/glast/omodei/DATA/GBM/GRBYYMMDDFFF)
The gtgrb code is maintained in CVS, and the common framework aids development of new scripts and ensures transparency. Developers take care of interfacing a script with gtgrb and providing a method to call a script.
Assumption: This tutorial assumes that you familiar with the LAT Science Tools and are running a ScienceTools SCons build (e.g., /Optimized/ScienceTools/09-16-01) on a SLAC Public, RHEL4 machine.
Tip: The gtgrb_slac script defaults to ipython, which uses the "In [1]:" prompt instead of the ">>>" prompt. If you are running in a non-SLAC Public, non-ipython environment, you can change the default setting in the gtgrb_slac script by commenting out the following line:
/afs/slac/g/ki/bin/ipython -profile glastgrb "$1"
and uncommenting the following line:
#python -i "$@"
Part 1: gtgrb Setup
- Login to your SLAC Public account.
- SSH to the least busy RHEL4 machine:
chuckp@noric06 $ ssh rhel4-32
- Get the gtgrb code:
- Create a working directory (e.g., myGRB05)
- Enter:
chuckp@noric10 $ bash
bash-3.00$ cd myGRB05
bash-3.00$ cvs co -d GRBanalysis -r v2r3 users/cohen/GRBanalysisNote: The -d option redirects users/cohen to your working directory. The GRBanalysis directory will be created in your work directory.
- Check the contents of the newly created GRBanalysis directory:
bash-3.00$ cd GRBanalysis
bash-3.00$ lsAs shown below, your GRBanalysis directory should include the ipython initialization scripts (ipythonrc, ipy_user_conf, and ipy_profile_glastgrb.py); it should also include GTGRB (the actual python package) and gtgrb_slac (the executable, i.e., a shell script wrapping the call to ipython).
CVS
GRB080702B.py
GTGRB
Makefile
gtgrb.doxy
gtgrb.pargtgrb.py
gtgrb_example
gtgrb_slac
ipy_profile_glastgrb.py
ipy_profile_test.py
ipy_user_conf.py
ipythonrcmatplotlibrc
opssim2_GRB090308937.py
scripts
templateAnalysis.py
- Edit the gtgrb_slac script:
Refer to the example of the gtgrb_slac script (edited for an SCons build of ScienceTools-09-16-01), and then edit the gtgrb_slac script as appropriate in order to reflect your local setup:
Note: The bash script "gtgrb_slac" contains all the environment variables and the instructions to set up gtgrb at slac.
emacs gtgrb_slac Observe that one of the first things the gtgrb_slac script does is export the INDIR and OUTDIR; the default directories are:
DATA/FITS/GBM
DATA/FITS/LAT
DATA/GRBOUT
The first two (DATA/FITS/GBM and DATA/FITS/LAT) are input directories where gtgrb will save the files retrieved from the astroserver (LAT files), and from the FSSC (GBM files). gtgrb will also "look" into these directories and, if the correct file(s) already exist, they will not be downloaded again.
Also observe that the Science Tools installation CMT section has been commented out.
For the purposes of this tutorial, in the Science Tools installation SCONS section of the gtgrb_script, be sure to update the line beginning "export INST_DIR" to the latest released version of the SCONs ScienceTools build which, at the time of this writing, is:
/nfs/farm/g/glast/u35/ReleaseManagerBuild/${PLAT}/Optimized/ScienceTools/09-16-01
... and was the only edit necessary for this tutorial.
- Run gtgrb_slac:
bash-2.05b$source gtgrb_slac The gtgrb_slac readback will be displayed; then, after a momentary delay, the readback ends by displaying In [1]:, the 1st IPython prompt:
Also note that the IPython prompt is preceded by the instructions regarding how to get the file from the Astroserver, i.e., execfile("scripts/getFile.py"), and how to run the GRBREPORT script: execfile("scripts/GRBREPORT.py").
Part 2: Get the data (optional, see Tip, below)
- At the python prompt, enter:
Tip: The getFile.py functionality has been incorporated into the GRBREPORT.py (i.e., the necessary parameters for getFile.py are entered as part of the GRBREPORT.py parameters; hence, it is faster and easier to skip steps 6 and 7, below, and go directly to Part 3. Run GRBREPORT).
In [1]: execfile("scripts/getFile.py")
- At the following prompts, enter the GRB trigger time and the time before and after the trigger time (in seconds) for which you wish to retrieve data:
MET of the GRB= 243216766
BEFORE and AFTER= 1000The name of the file will be returned:
Name of the file= [080916009]
Hit the Enter key.
Part 3: Run GRBREPORT
- Run the LAT GRBREPORT:
In [1]: execfile("scripts/GRBREPORT.py")
- Enter LAT GRB Parameters as appropriate
Note: Later in this exercise, we will be refining the position; we will then be returning to this step to enter the new parameters (i.e., referred to as performing Pass02):
- If this is the first pass (Pass01), enter parameters as shown in Pass 01: LAT GRB Parameters.
- If this is the second pass (Pass02), enter parameters as shown in Pass 02: LAT GRB Parameters.
Pass01 will produce the following result:
- Plot the orbital profile:
plot angular separation? [y/N]y
Pass01 will produce:
... and it will produce the following plot:
Tip: If a blank window is displayed, click in it to refresh the screen.
 |
To save an image, click on File --> Save --> <image format>; the image will be saved to your work directory/GRBanalysis. |
- Select the data:
- Select data (according to the parameters you have entered):
make select? [y/N]y
- When prompted to apply an energy dependent selection:
if No, the default selection will be based on a fixed ROI;
if Yes, rspgen_v5 will be called.
Apply an energy dependent selection? [y/N]:y
- If you plan to run rmfit, set the "Make PHA2 and RSP" option to "y"; gtgrb will make the pha2 files and save them in the correct format to be used in rmfit.
For the purposes of this tutorial, select No:
Make PHA2 and RSP [y/N]:N
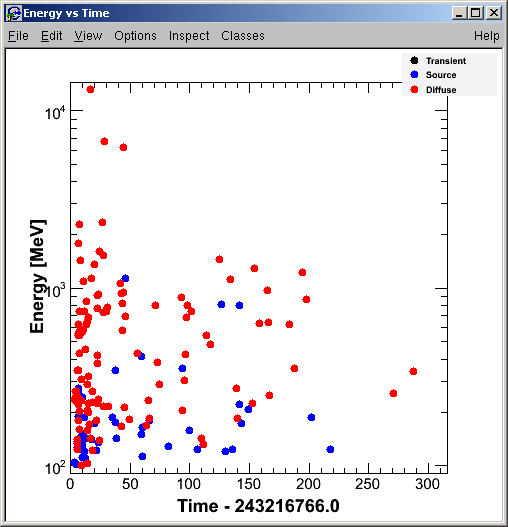
Pass01 will produce:
... and the Energy vs Time plot for the LAT ROI is displayed:
- Make LAT Light Curve and SkyMap:
Make LAT LC and SkyMap? [y/N] y
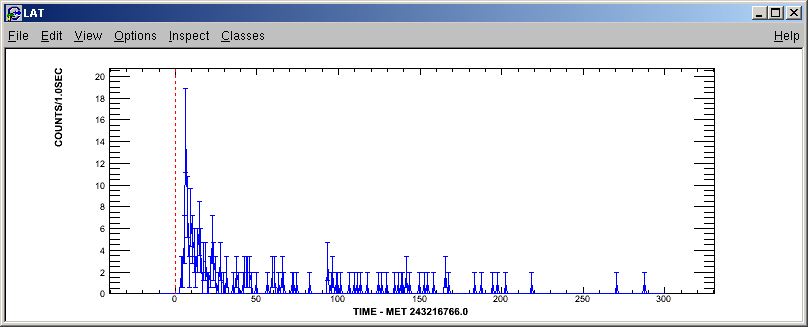
LAT LIGHT CURVE BIN SIZE (seconds) [0.1] 1Pass01 will produce:
... and the following light curve plot will be displayed:

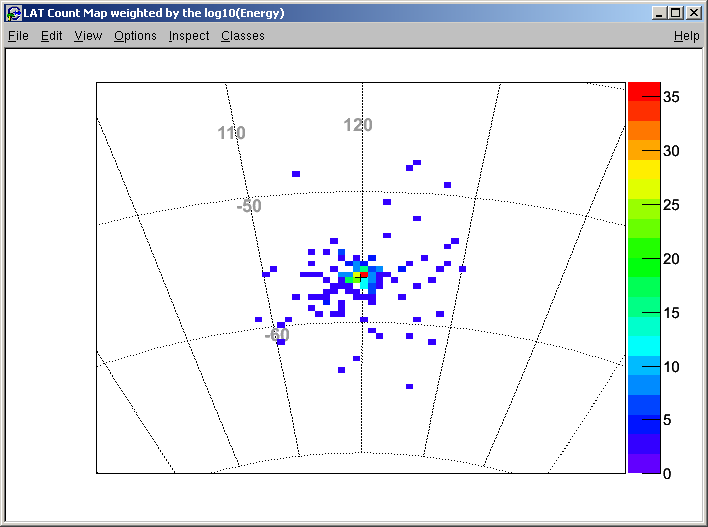
SKY MAP Bin size (degrees): [0.25] 1
Pass01 will produce:
... and the following LAT Count Map will be displayed:
- ds9 not available:
is ~/ds9 available? [y/N]N
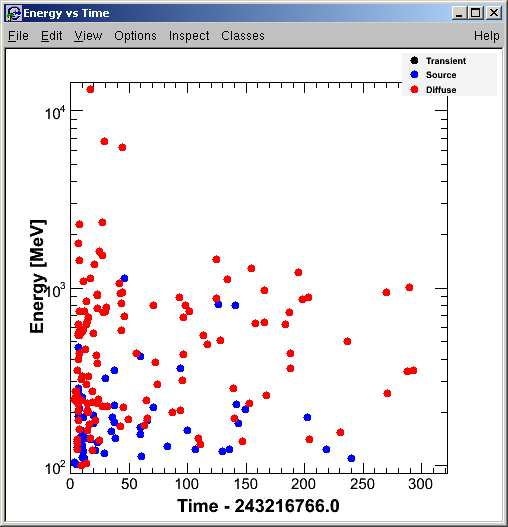
Pass01 will produce:
... and Energy vs Time #2 is displayed:
- Compute better position with gtfindsrc:
Note: This completes Pass01.
- If you have already returned to the beginning of Part 3, updated the position parameters and completed Pass02 to this point, proceed to step 16, below.
- If you have not yet performed Pass02, continue with step 15 a and make a note of the coordinates and error circle radius, then compute a better position:
Compute better position (gtfindsrc)? [y/N]:y
- Make a note of the following 'Best fit position' and 'Error circle radius' produced by Pass01:
Enter coordinates for test source:
Best fit position: 119.835, -56.5696
Error circle radius: 0.0684913- Update the position parameters. Now that you have a better position, return to the beginning of Part 3 and update the position parameters.
Note: To start over, press the <ENTER> key until you exit from GRBREPORT and return to the IPython prompt (i.e., at the time of this writing, it was 4 times). At the prompt, go to the beginning of Part 3: Run GRBREPORT and enter the Best fit position and Error circle radius, then repeat the rest of the procedure, this time entering N when asked if you want to compute a better position.
- Make Likelihood Analysis:
Compute better position (gtfindsrc)? [y/N]:N
get GBM data? [y/N]N
make GBM light curve? [y/N]N
make LIKELIHOOD ANALYSIS? [y/N]y
----- Making the XML Model:
[1] - GRB only
[2] - GRB + Isotropic
[3] - GRB + Isotropic + Galactic
[4] - GRB + Background Template
XML Model to build [2]:
Iso diffuse: Template (1) or Power law (2) [2]:
Compute Temporal Extended Emission? Enter time bins separated by comma/N: 0,100,200Note: There will be a lengthy delay ..., and then a readback will be displayed, ending with:
- Fix parameter(s) (optional). At this point, you can choose to fix parameters, or not.
For example: If you wish to fix the index of the powerlaw of the isotropic component to -2.2, you can enter:
For fixing Parameters, input SOURCE NAME, PARAMETER NAME, VALUE. Return to skip: EG_v02,Index,-2.2
The readback now reflects your change:
- If there are no more changes to parameters, hit: <Enter> to continue.
The following plots will be displayed:
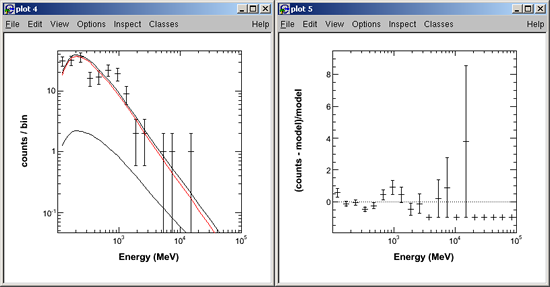
- Compute tsmap.
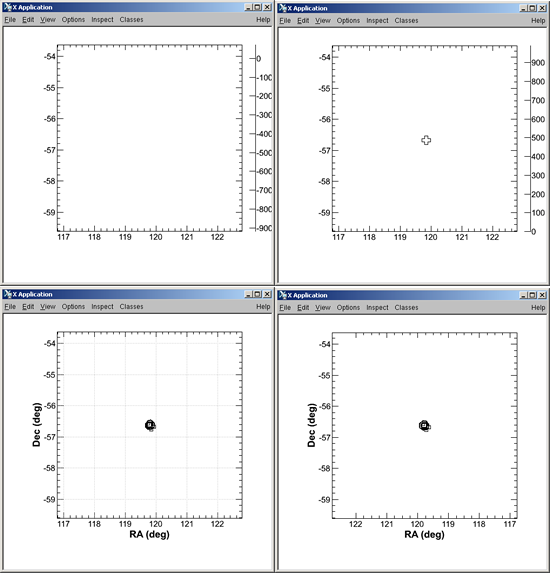
Compute tsmap using the current background likelihood model? [y/N]:y
There will again be a lengthy delay, and then the following maps will be displayed:
- Perform XSPEC Analysis and Compute LAT Spectrum:
make XSPEC ANALYSIS? [y/N]y
compute LAT spectrum (XSPEC)? [y/N]yPlease Note: At the time this was written, GRBanalysis failed when trying to perform the XSPEC analysis due to a programming glitch in v2r3. This problem has been fixed in the HEAD version and will be incorporated in the next release. The following steps were performed using an earlier version and are retained here as examples only. This tutorial will be updated to reflect the fix to this problem and incorporate any additional enhancements to GRBanalysis. Until then, please refer to: Nicola's gtgrb page in Confluence for the current status.
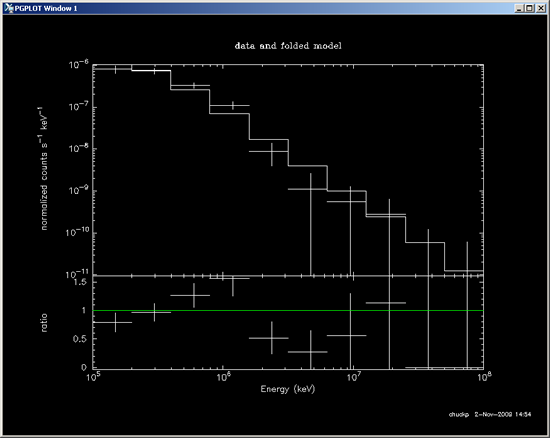
- Create PGPLOT: Data and Folded Model:
Note: In this step, the "@" plus the path and .xcm file created by XSPEC (see path and file name highlighted in red above) is entered in order to generate the data and folded model shown below.
XSPEC12>@DATA/GRBOUT/080916009/LAT_fit.xcm
- Exit XSPEC and Compute the UL without the background.
XSPEC12>exit
Do you really want to exit? (y) y
XSPEC: quit
compute GBM spectrum (XSPEC)? [y/N]N
compute GBM+LAT spectrum (XSPEC)? [y/N]N
Compute Upper Limit? [y/N]y
Compute the background? [y/N]NCreating xml file...
...adding a Point Source...
... closing the xml file
evtfile= DATA/GRBOUT/080916009/080916009_LAT_ROI.fits
scfile= DATA/FITS/LAT/ft2_243215766_243217766.fits
expmap= nonetime -p fselect infile="DATA/GRBOUT/080916009/080916009_LAT_SEL.fits" outfile="DATA/GRBOUT/080916009/080916009_LAT_SEL.fits" expr="EVENT_CLASS>2" index="OBSOLETE" histkw=yes copyall=yes keycopy=yes clobber=yes nrows=128 mode="ql"
real 0.07
user 0.01
sys 0.02
Selected : 817 Events...
Selected : 817 Events...
Compute upperlimit fixing the background? [y/N]N
Compute the UL without background? [y/N]y
- To exit python, enter:
In [3]: <Ctrl-D>
- Check Files in DATA/GRBOUT Directory for GRB 080916009
bash-2.05b$ ls DATA/GRBOUT/080916009/
| Owned by: Nicola Omodei |
| Last updated by: Chuck Patterson 05/04/2010 |