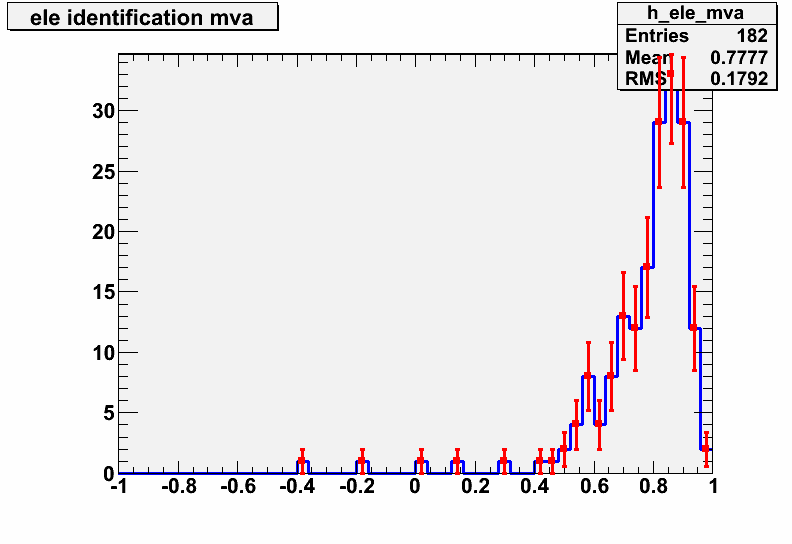
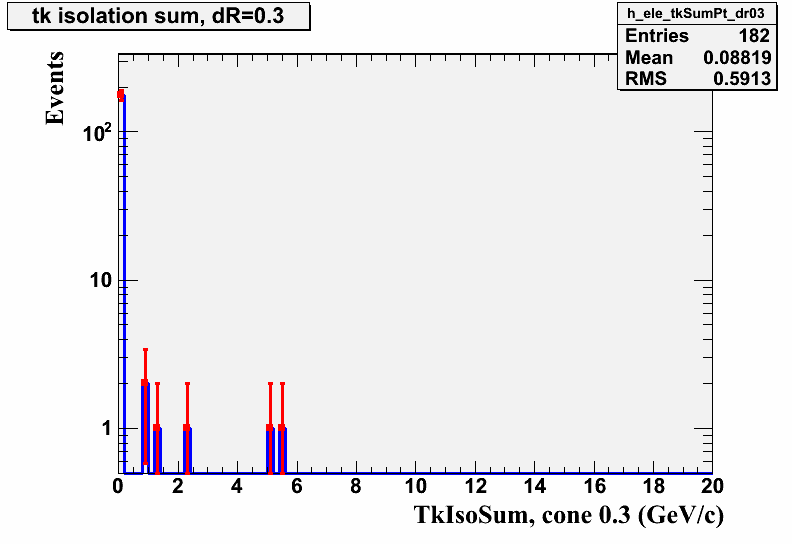
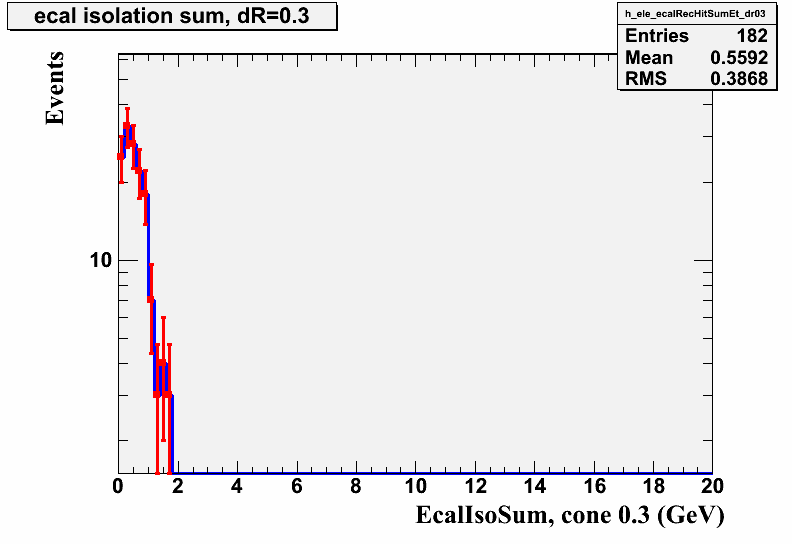
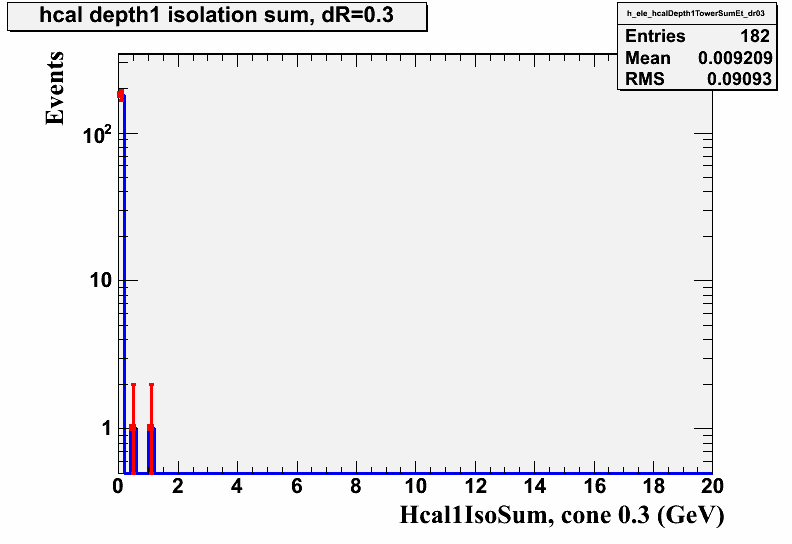
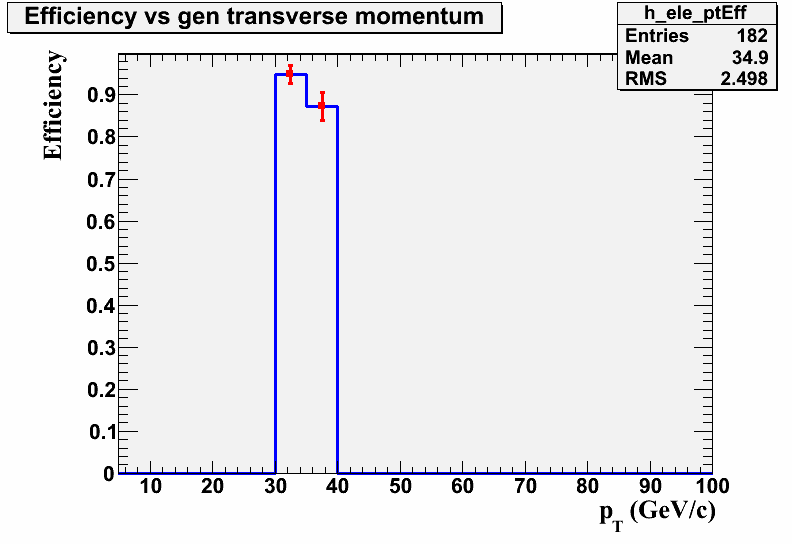
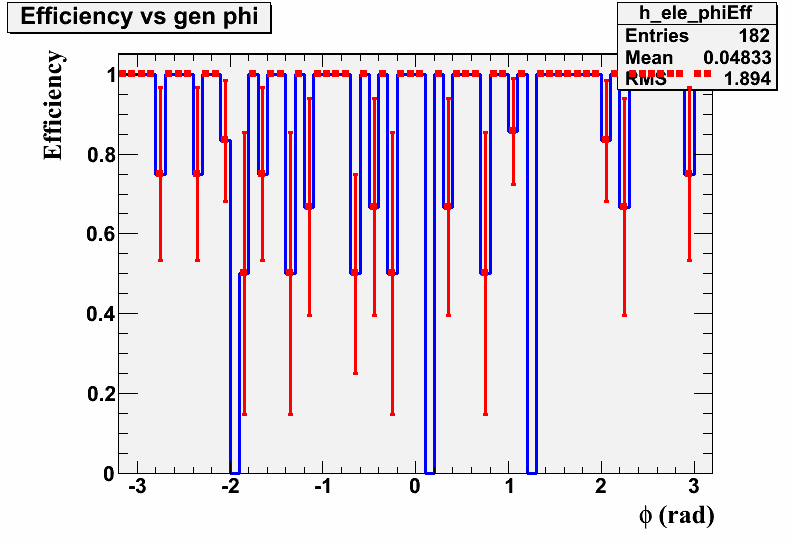
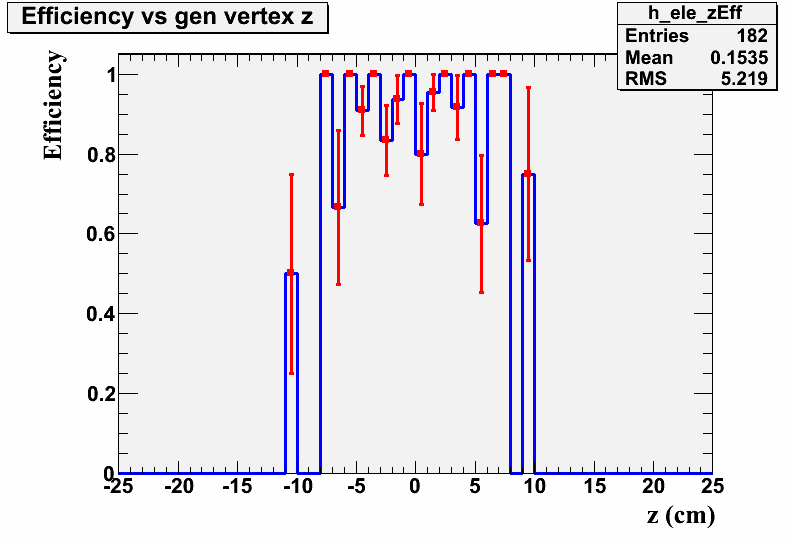
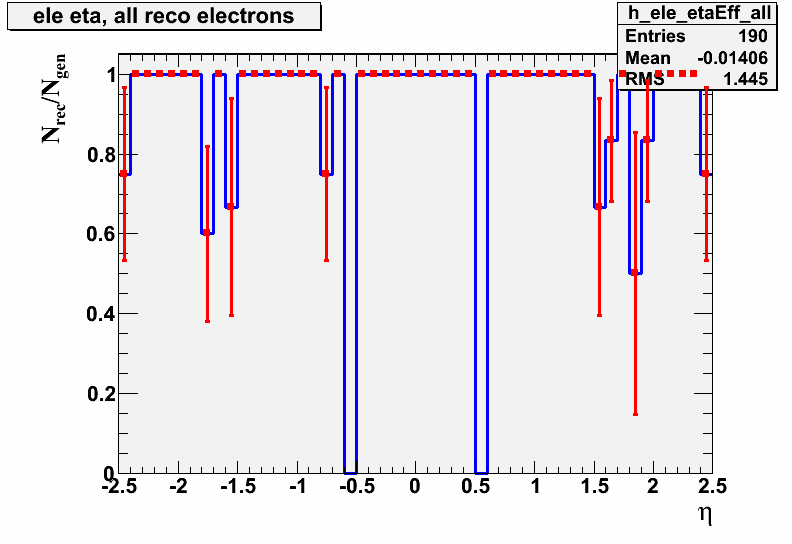
The following plots were made using analyzer RecoEgamma/Examples/plugins/GsfElectronMCAnalyzer.cc and configuration RecoEgamma/Examples/test/GsfElectronMCAnalyzer_cfg.py, with dataset SingleElectronPt35 as input.
The script used to make the plots is here.
The list of histograms is here.
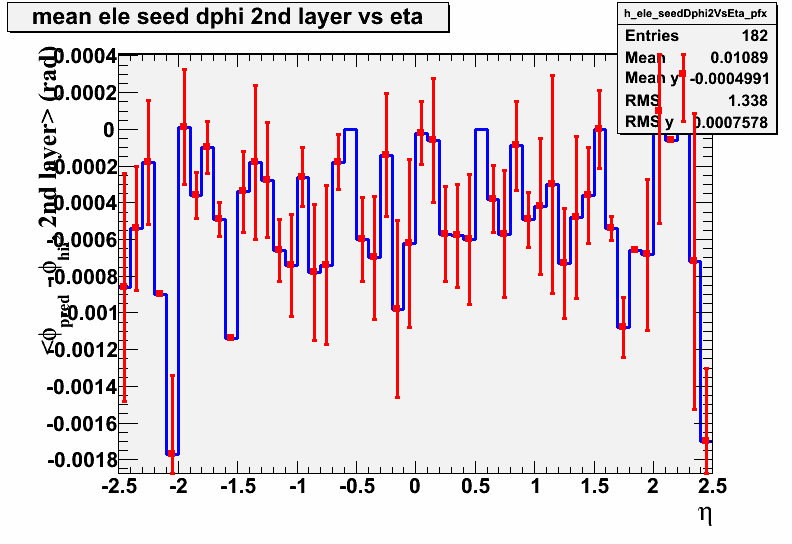
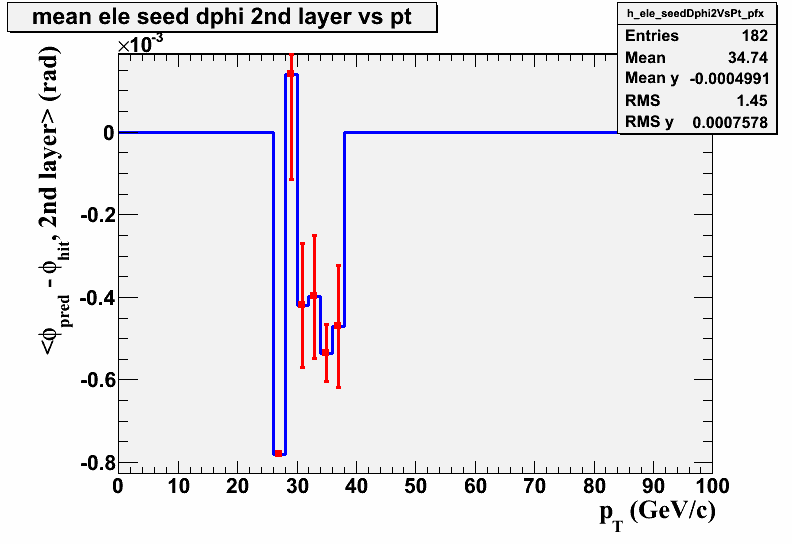
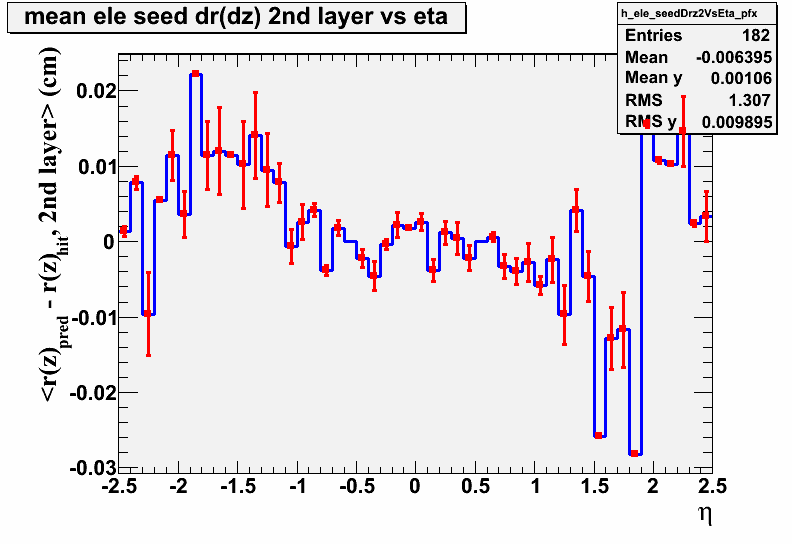
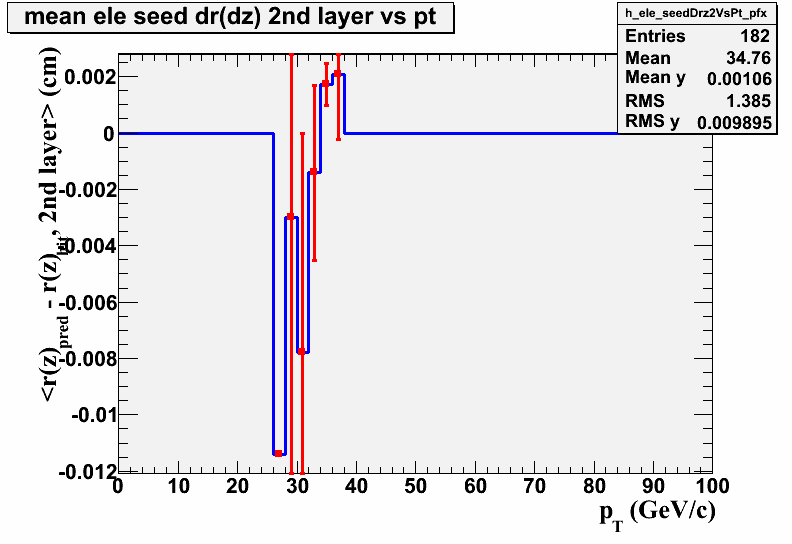
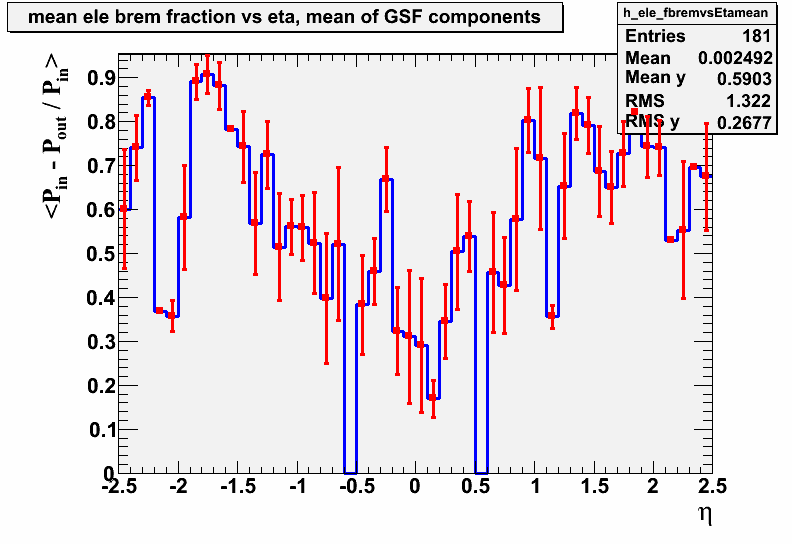
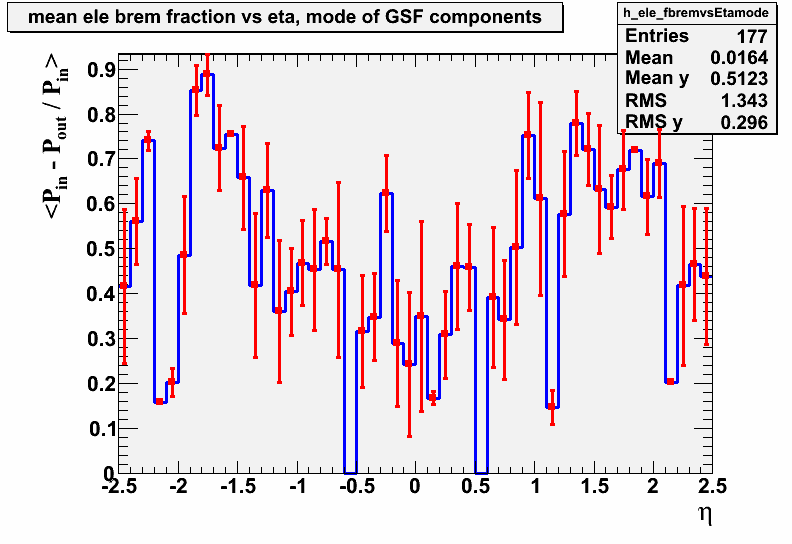
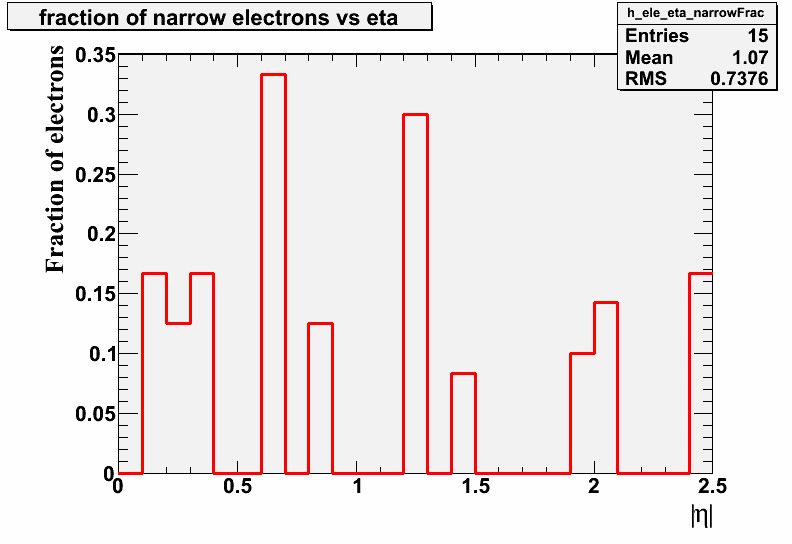
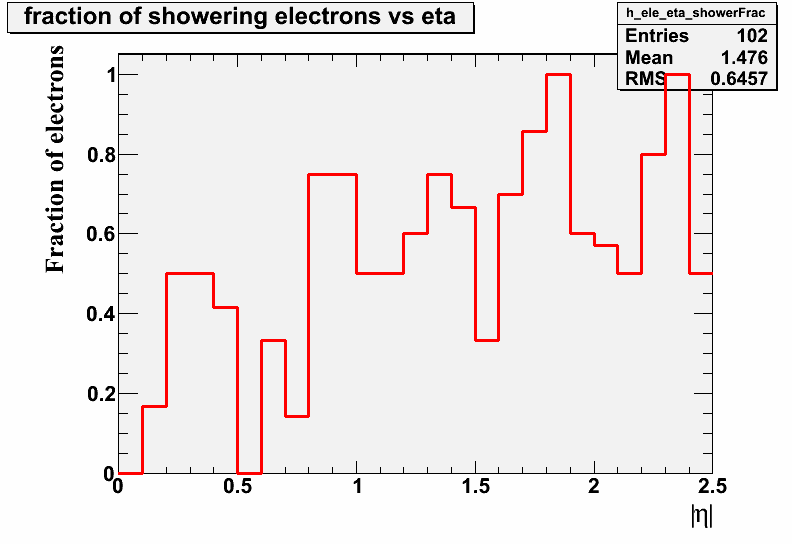
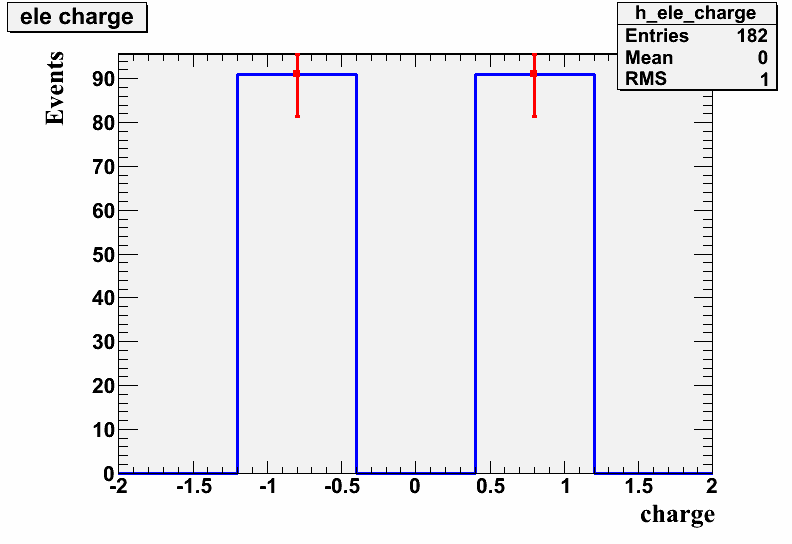
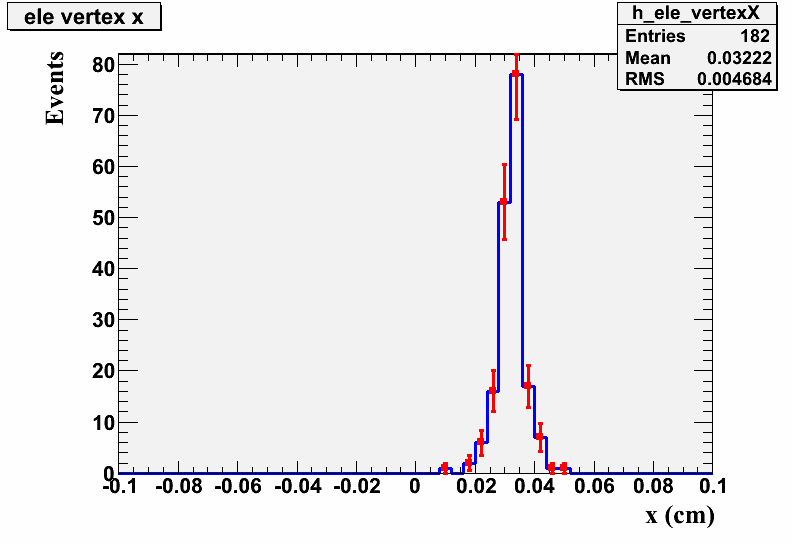
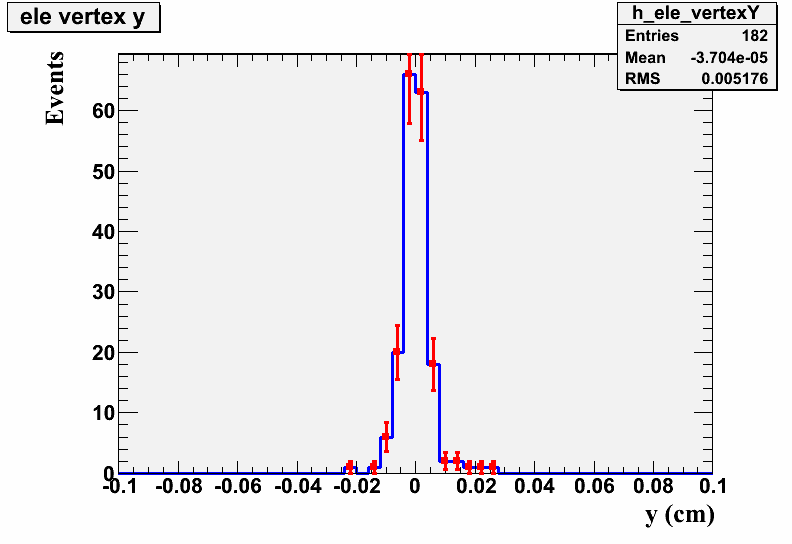
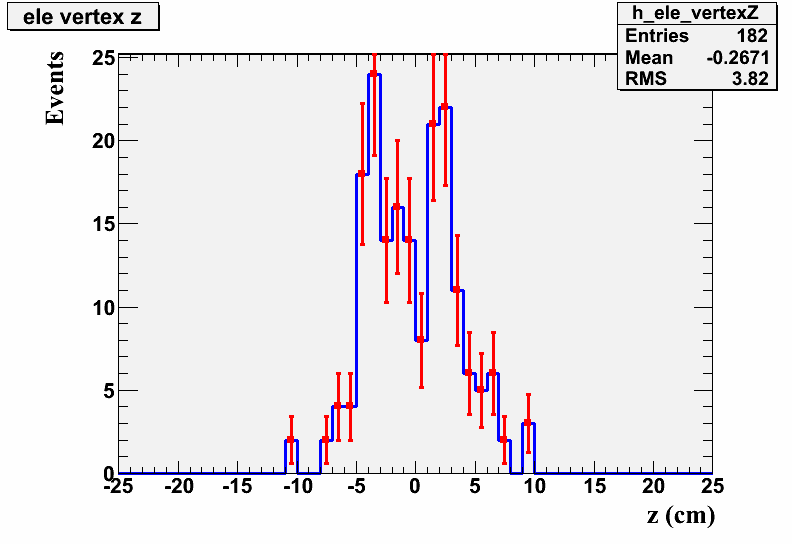
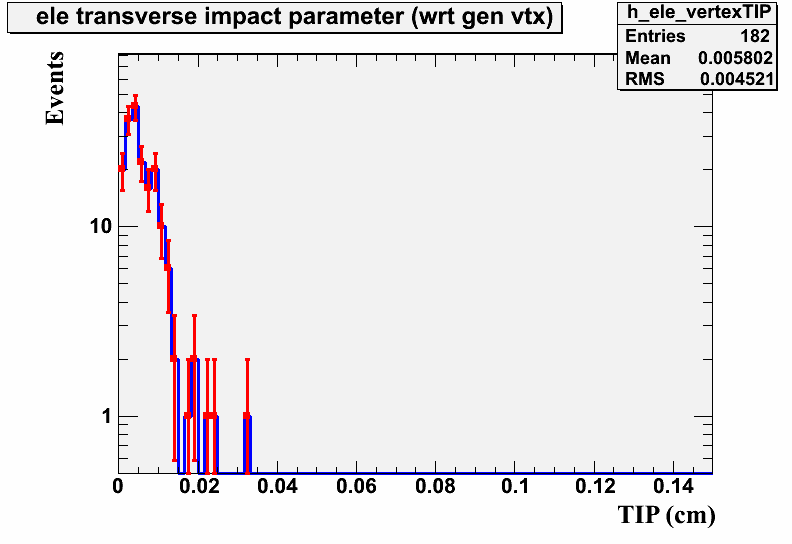
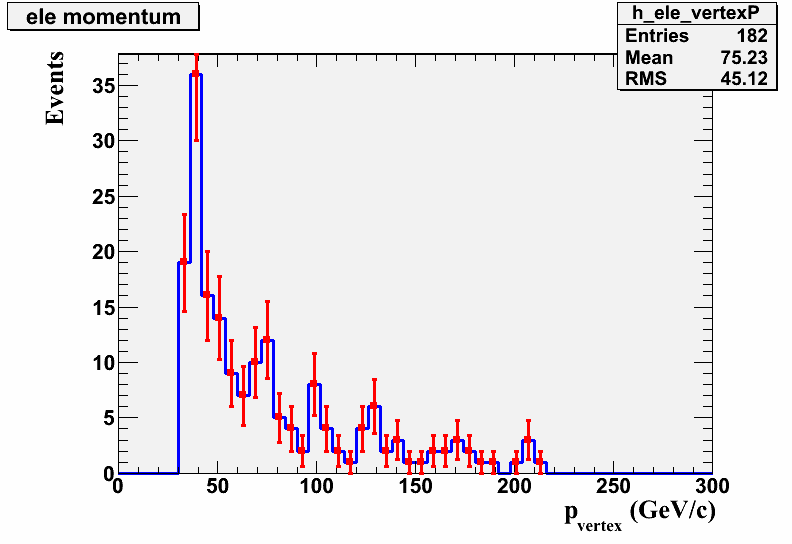
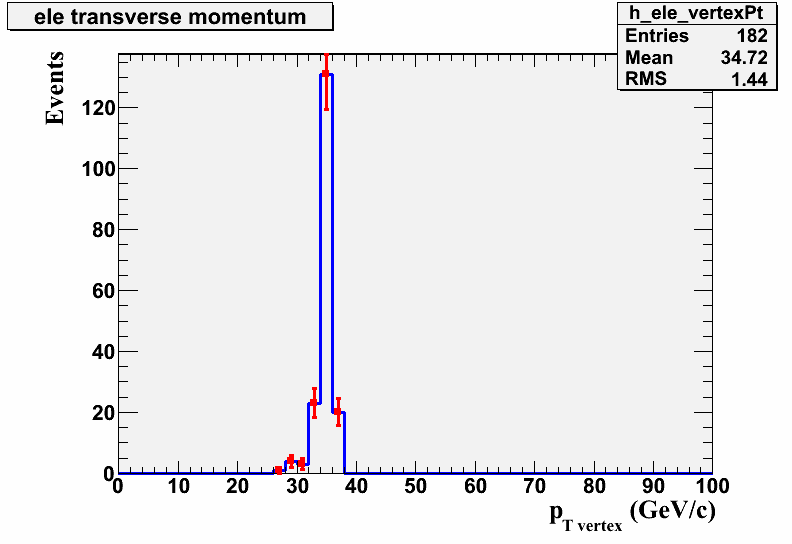
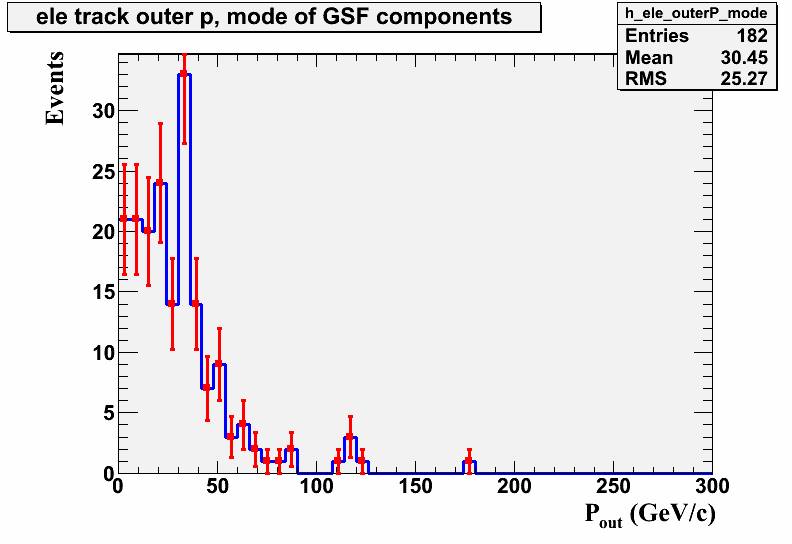
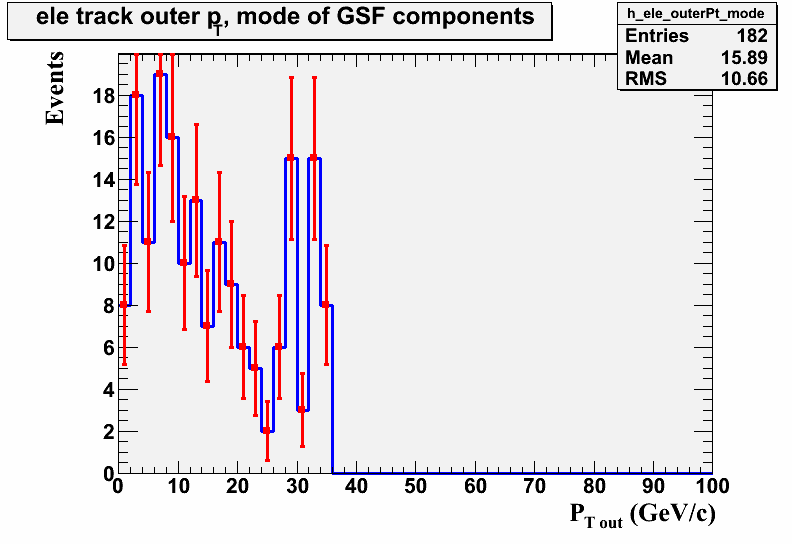
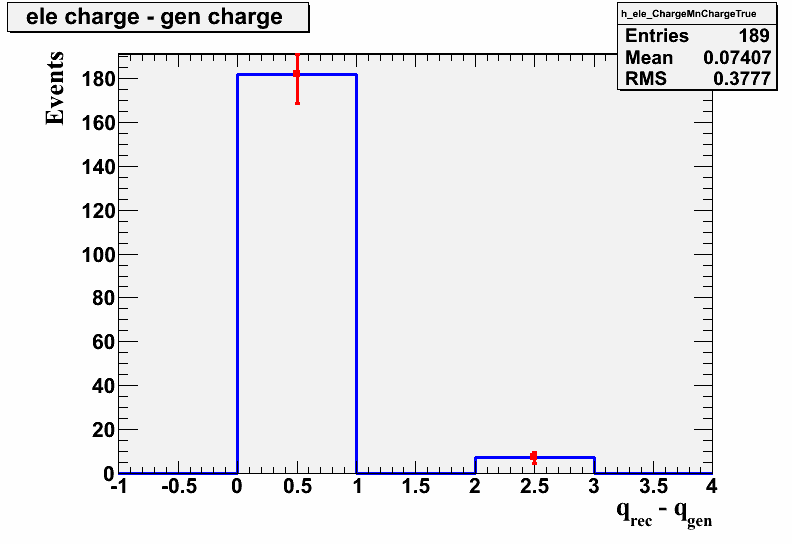
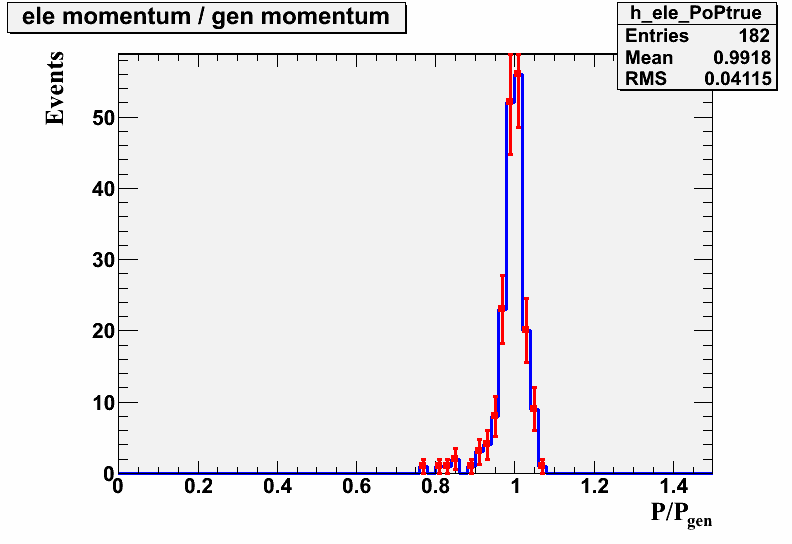
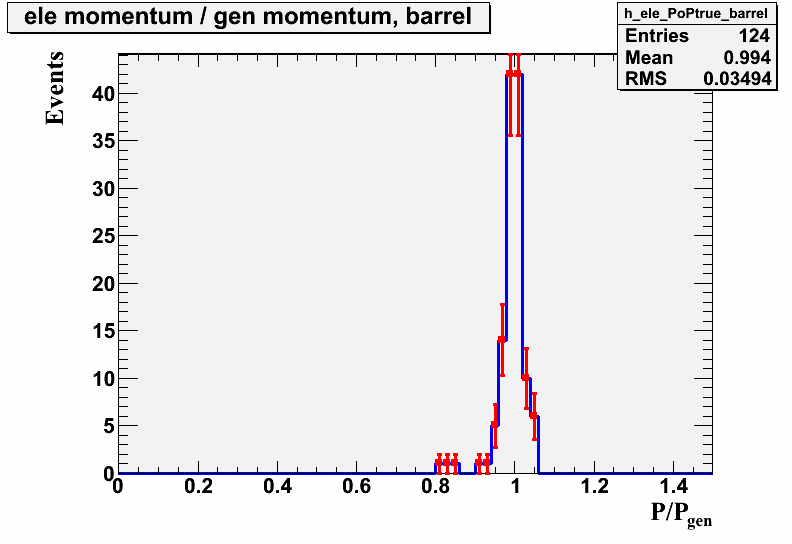
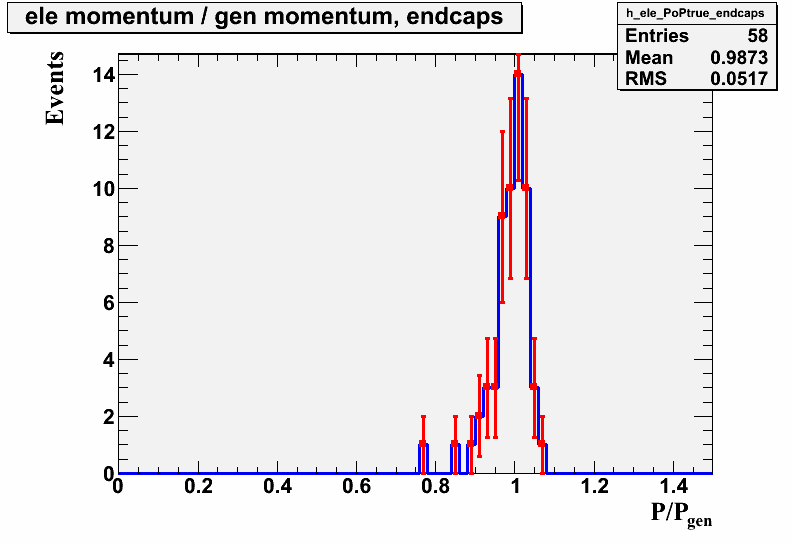
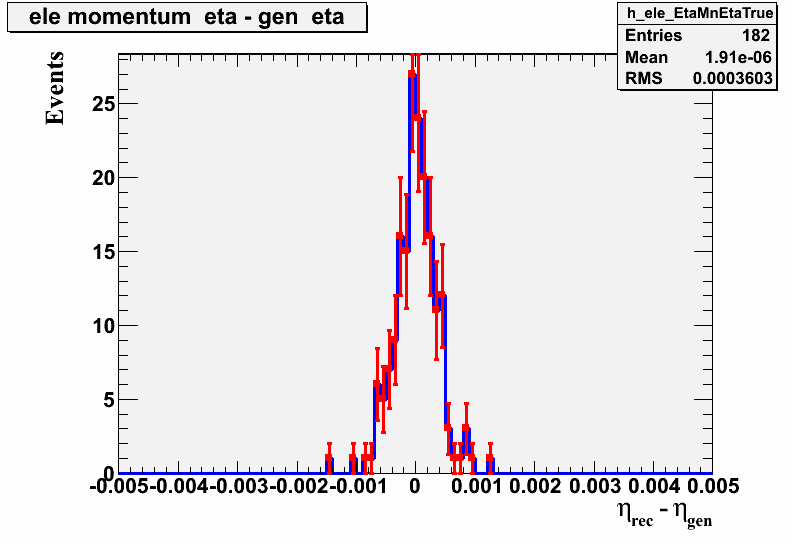
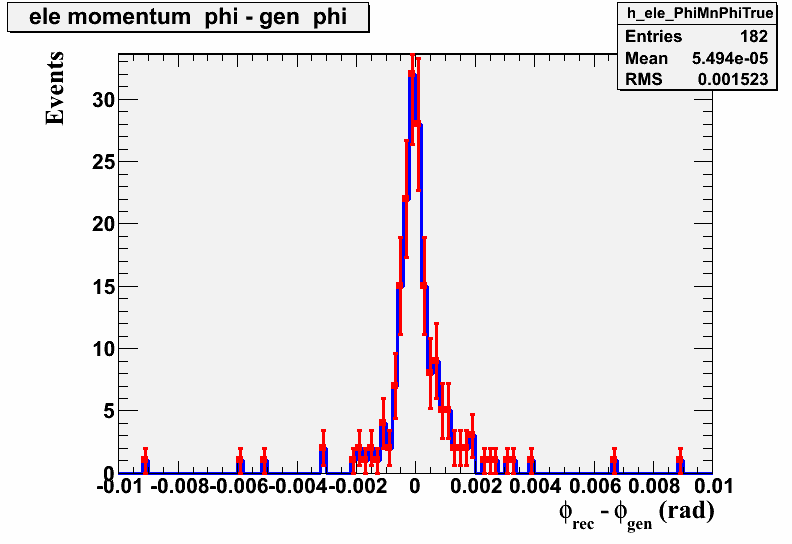
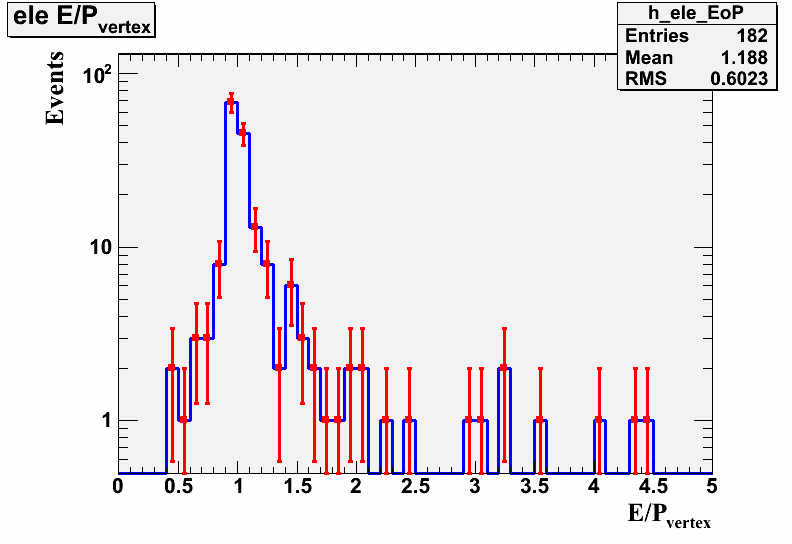
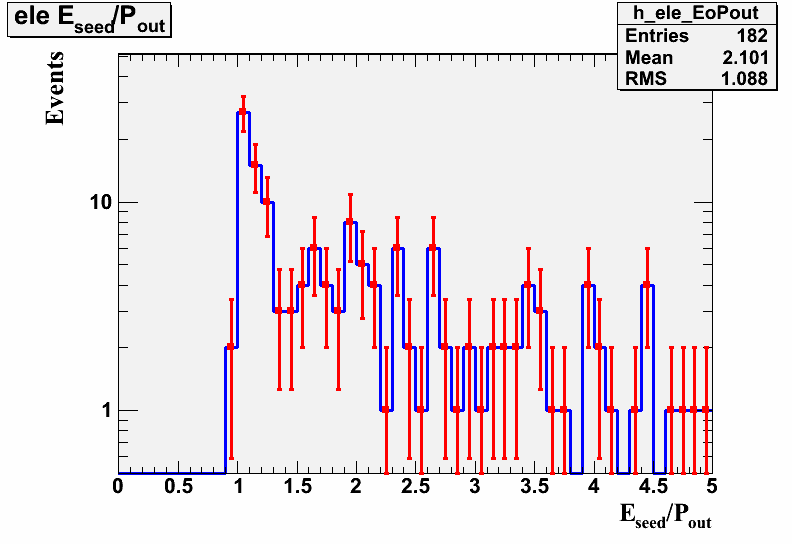
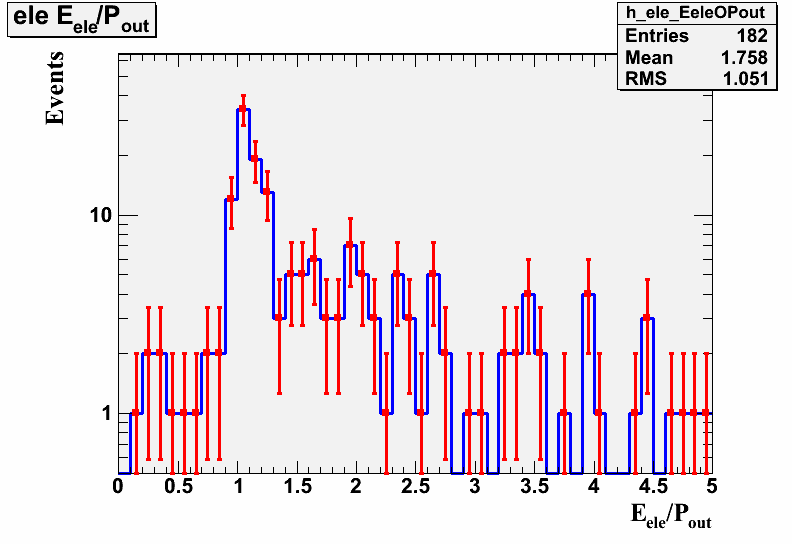
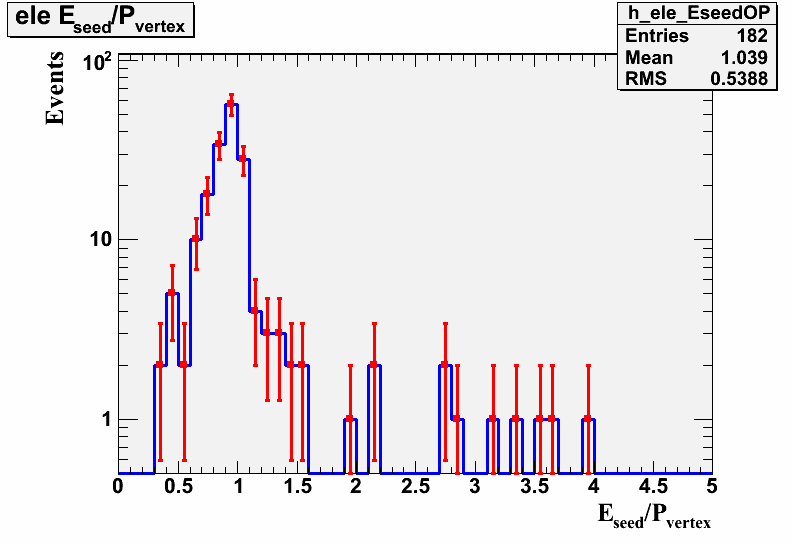
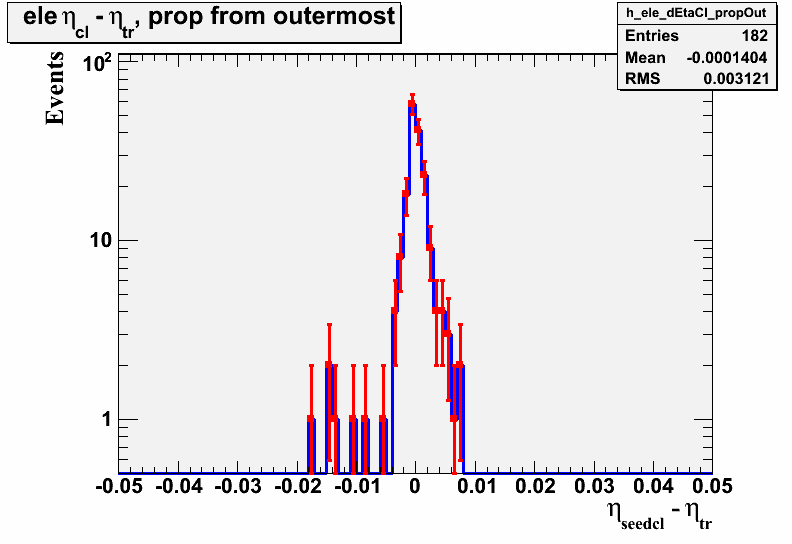
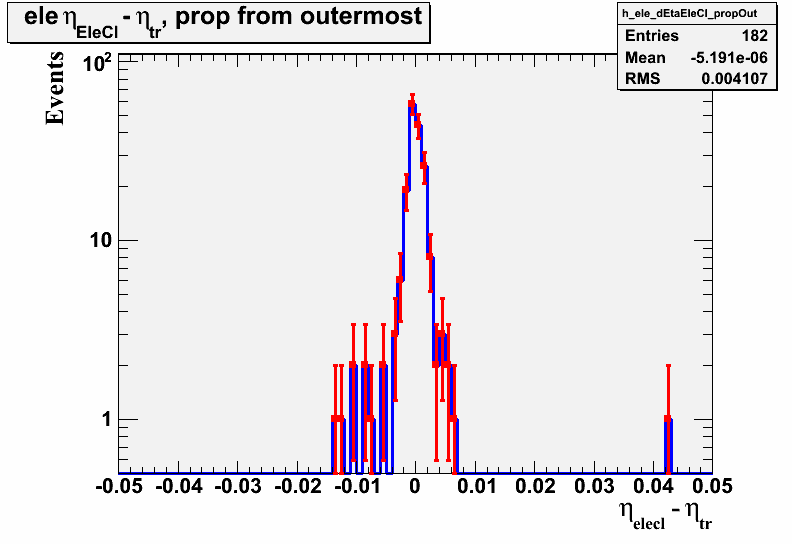
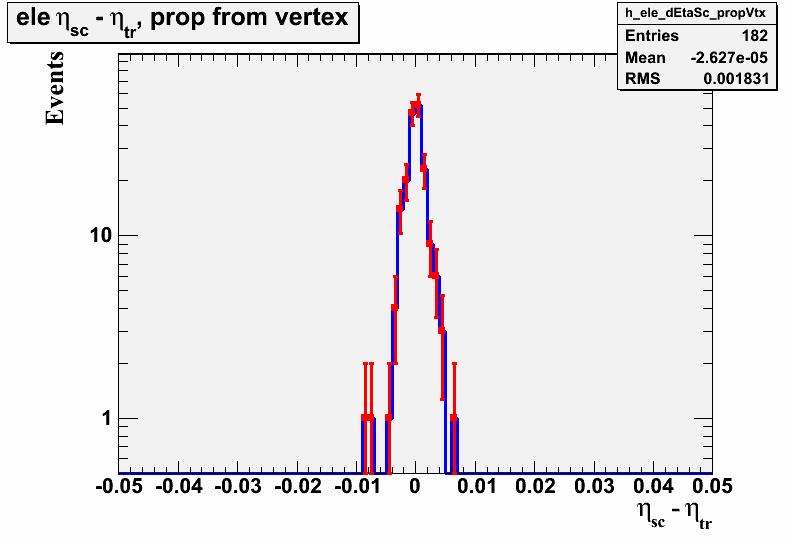
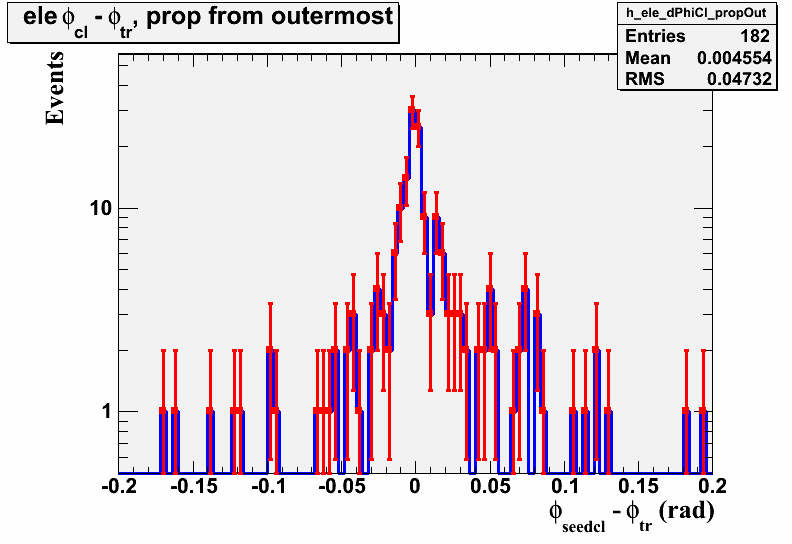
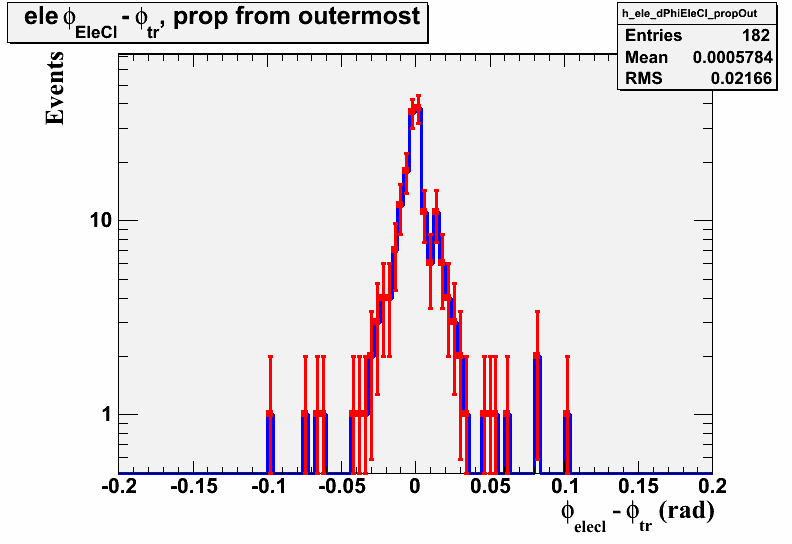
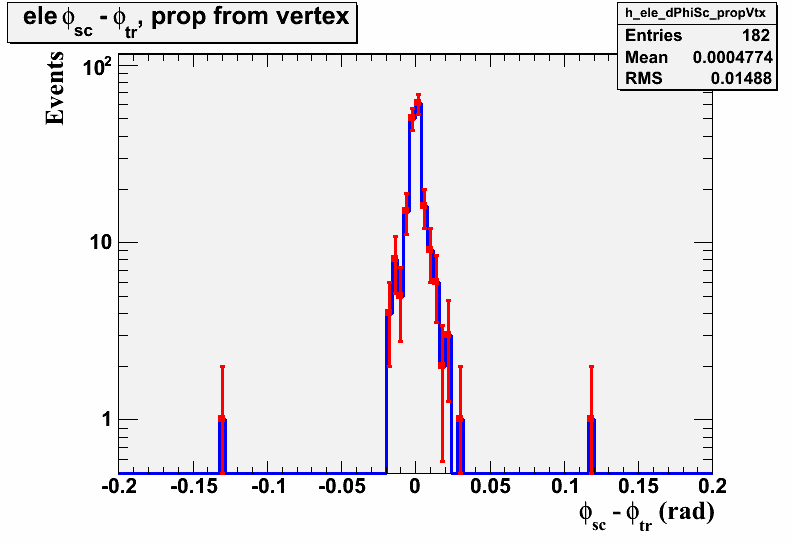
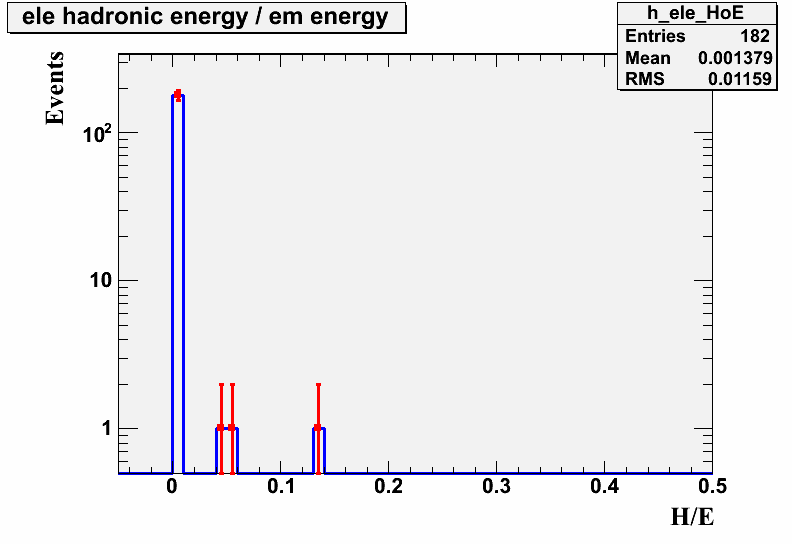
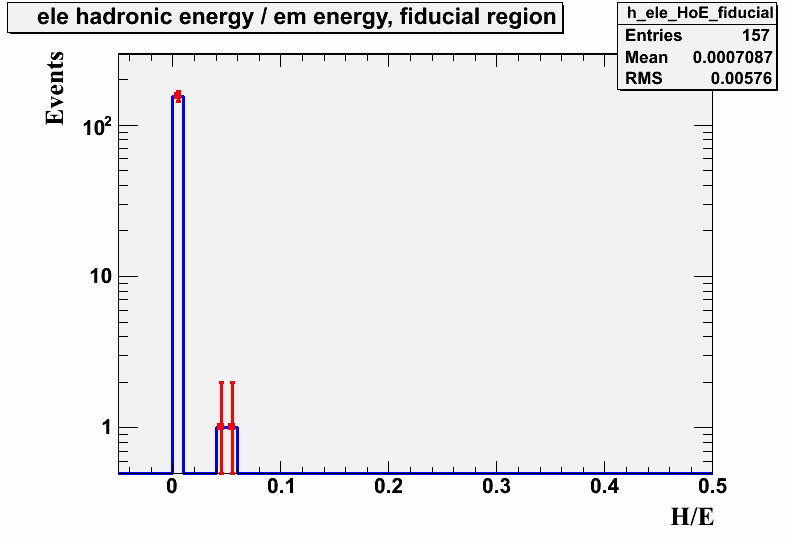
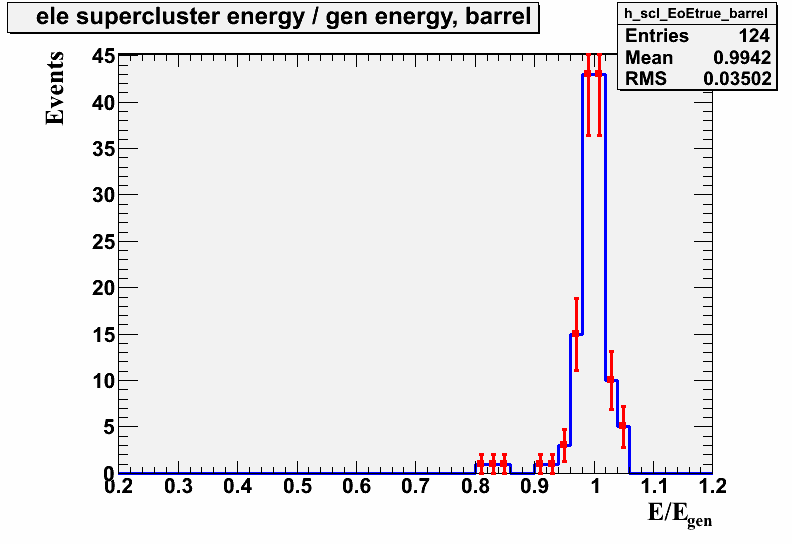
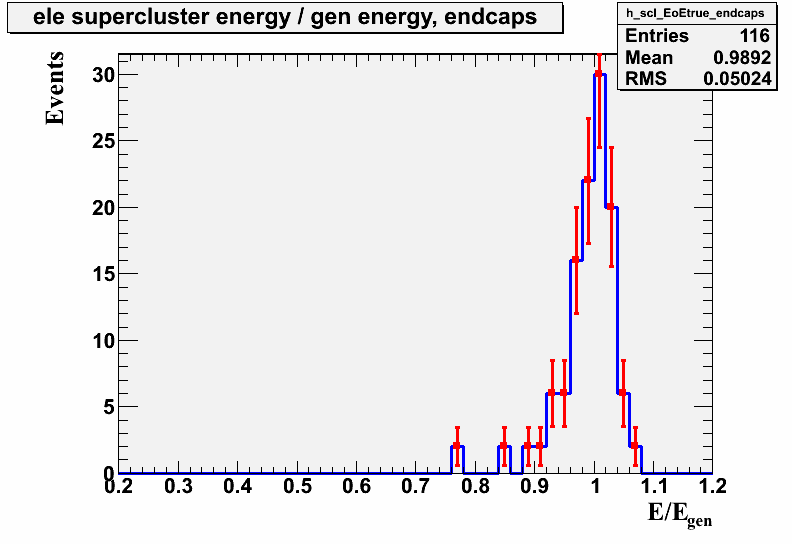
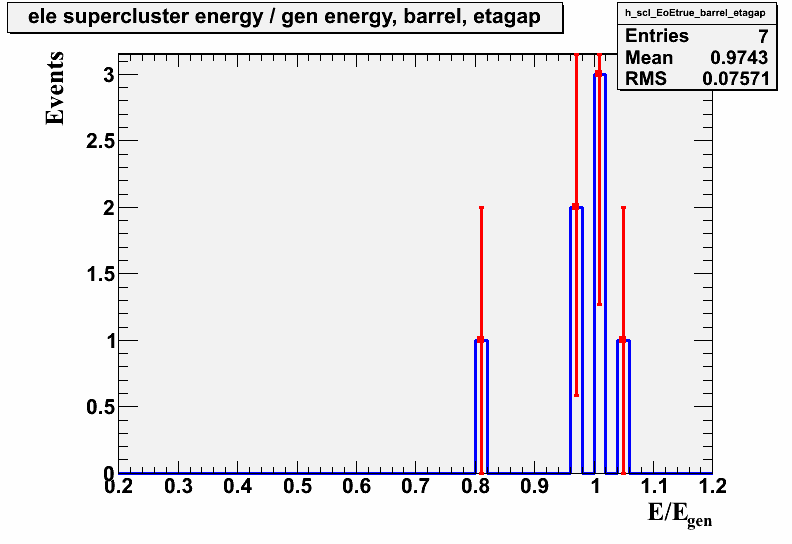
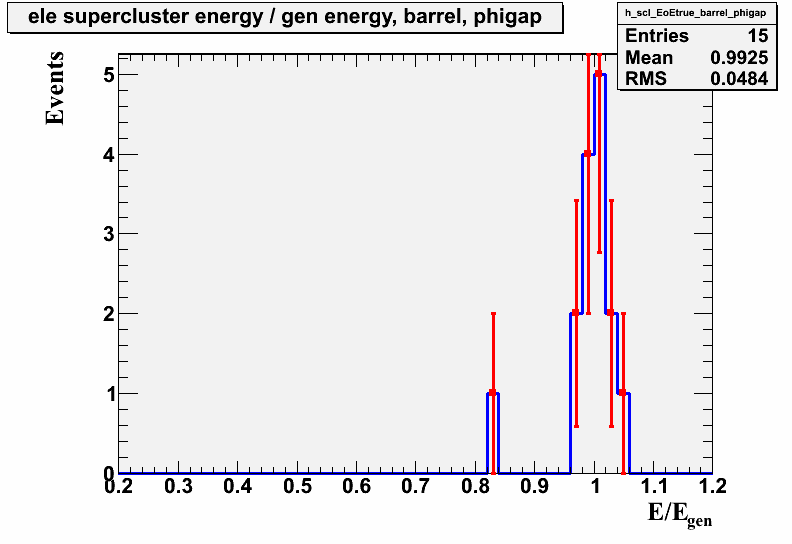
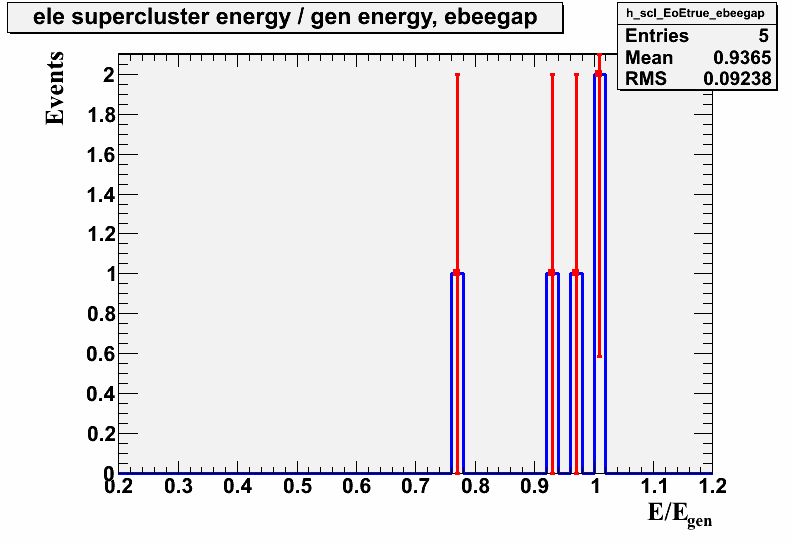
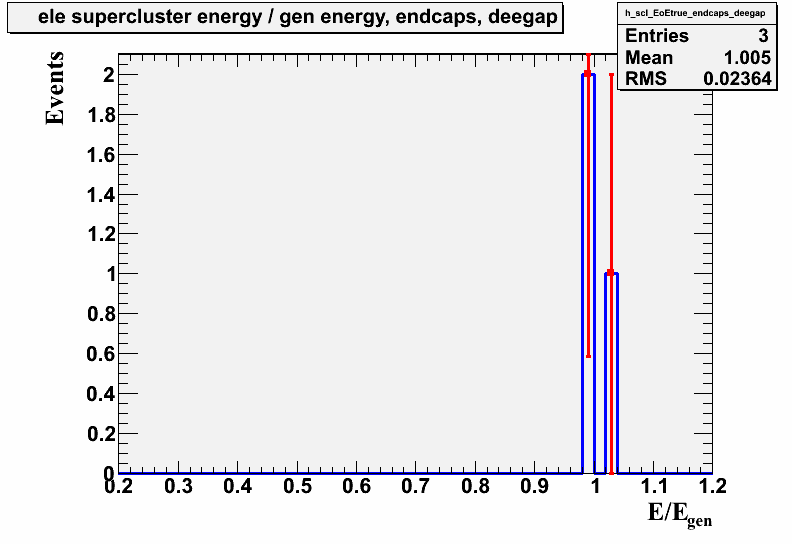
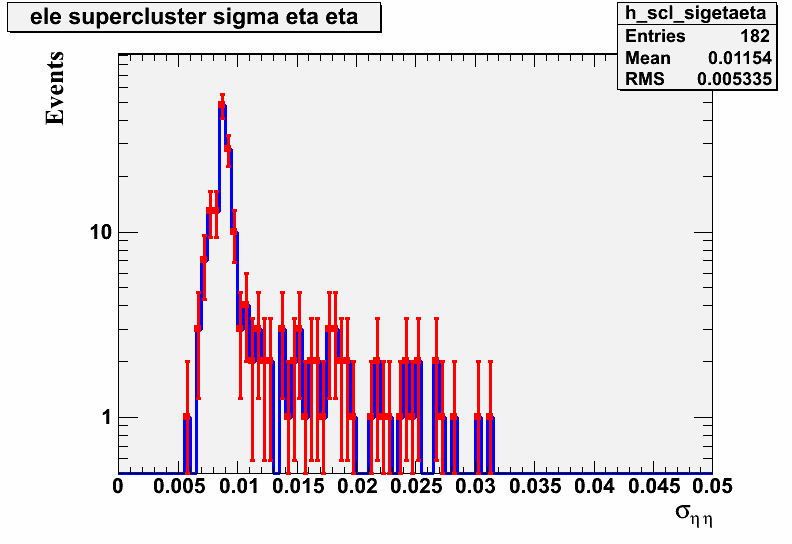
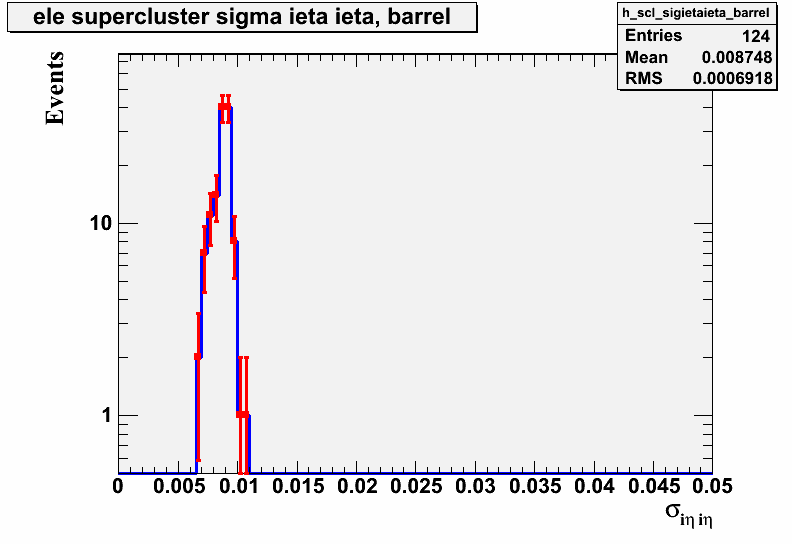
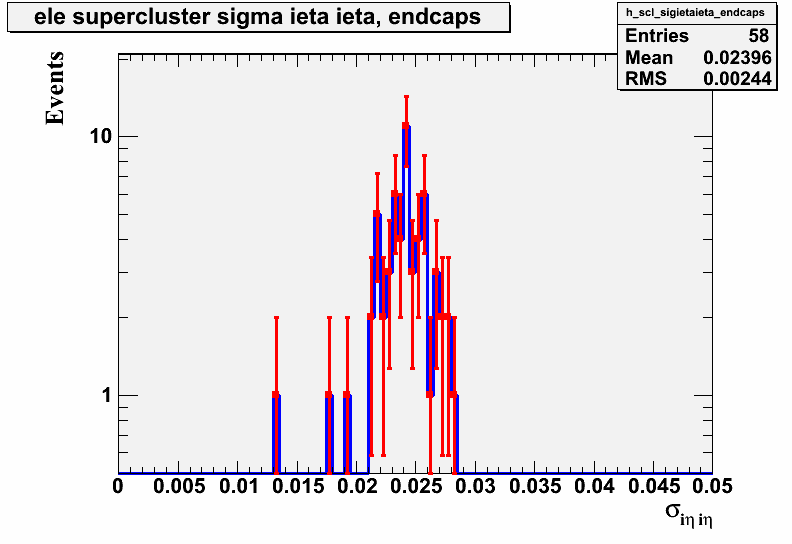
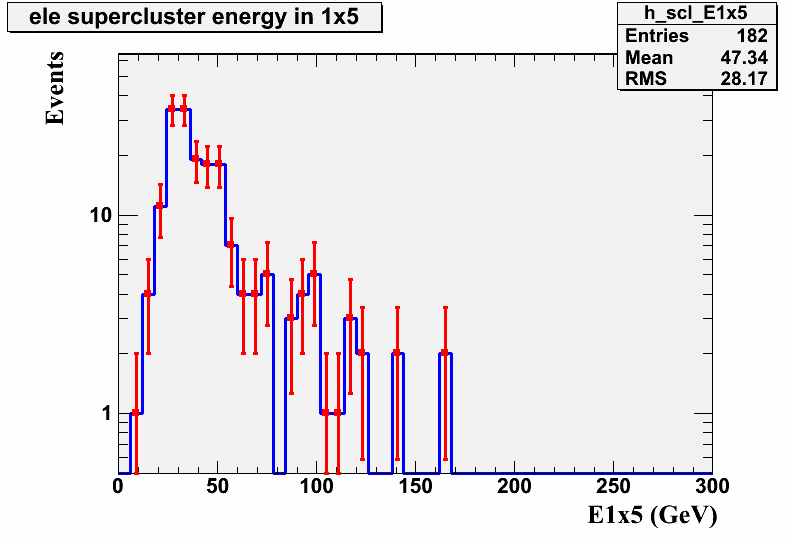
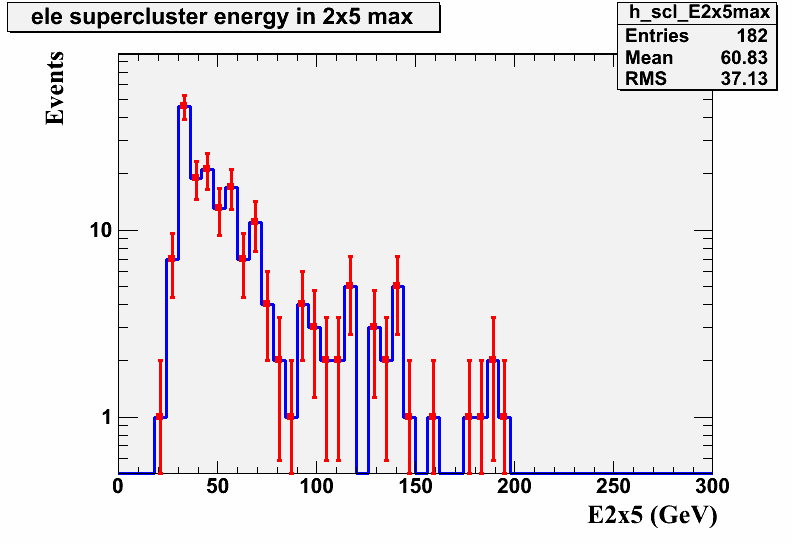
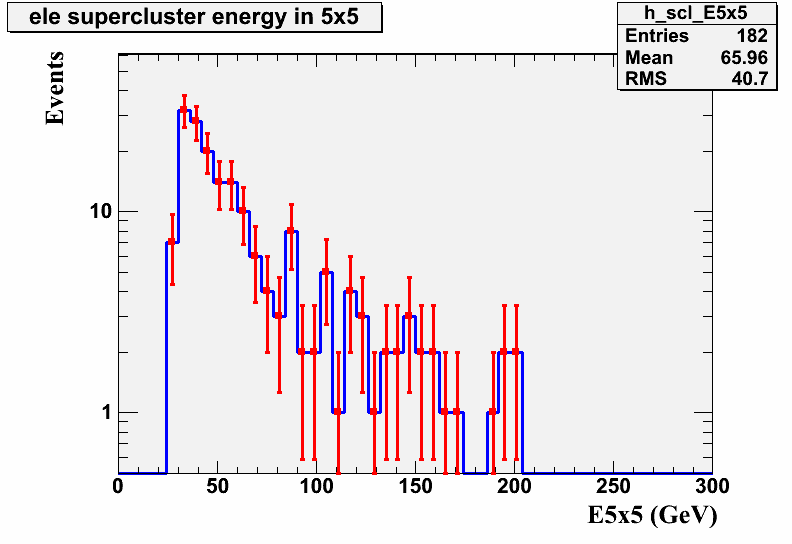
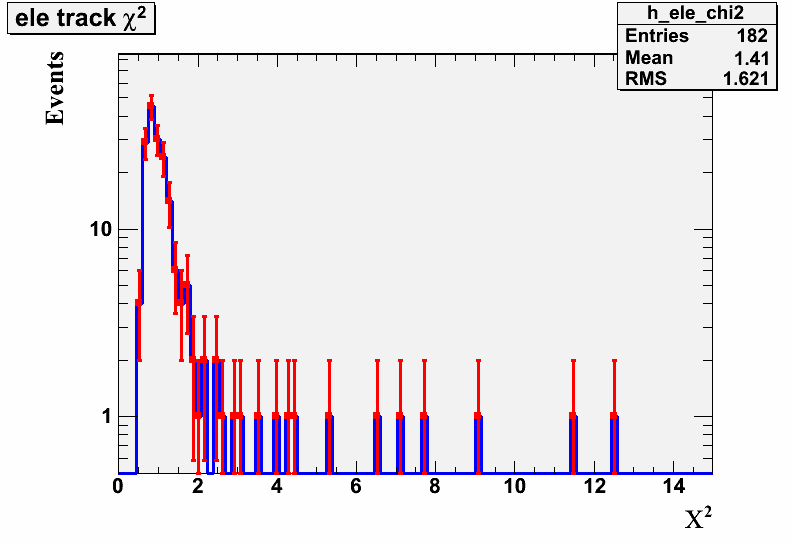
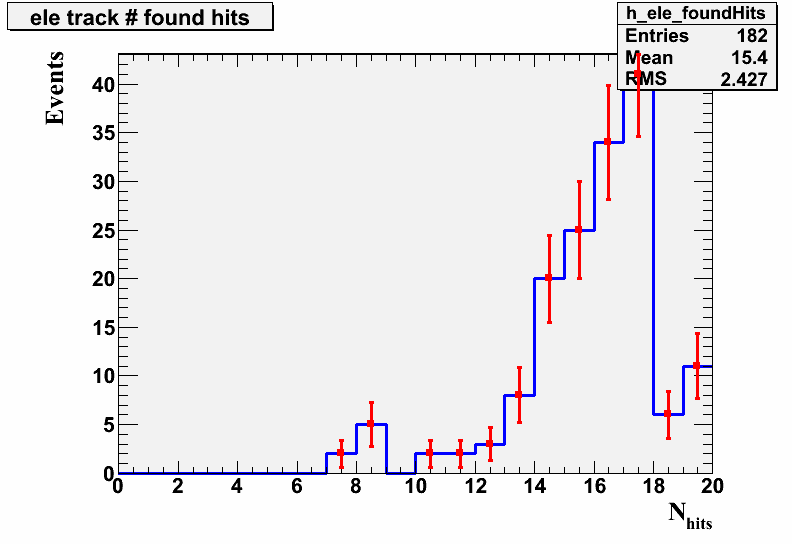
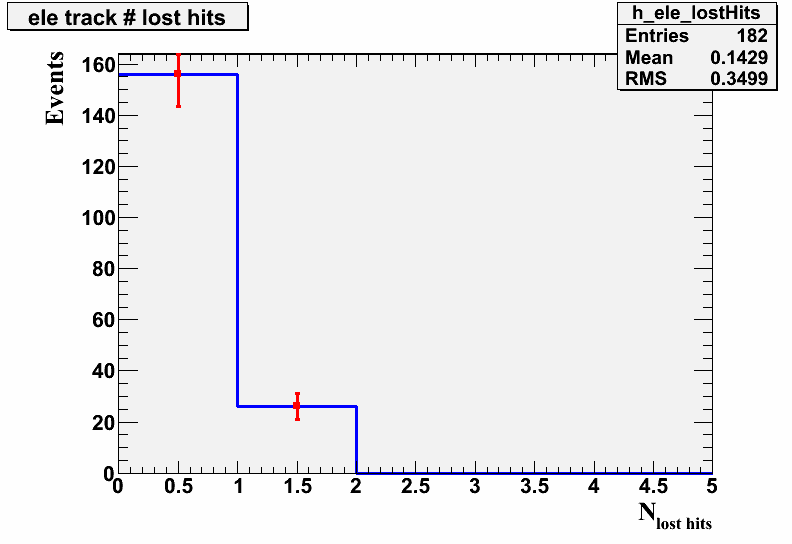
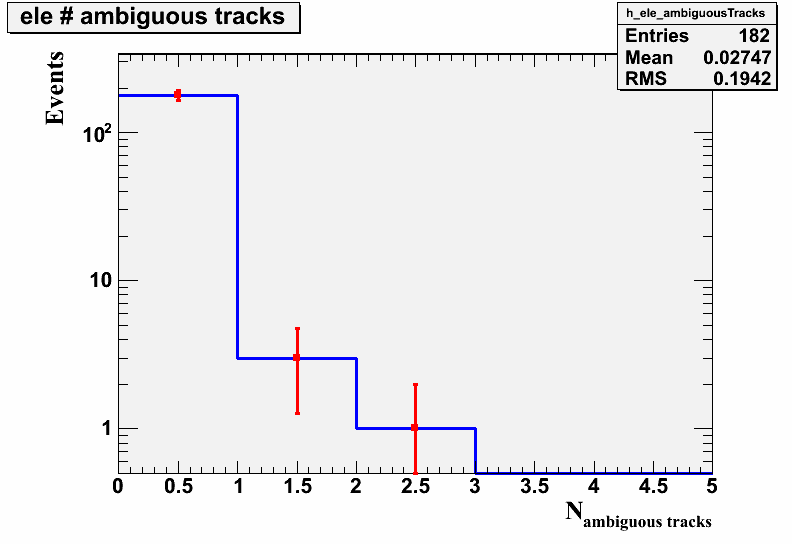
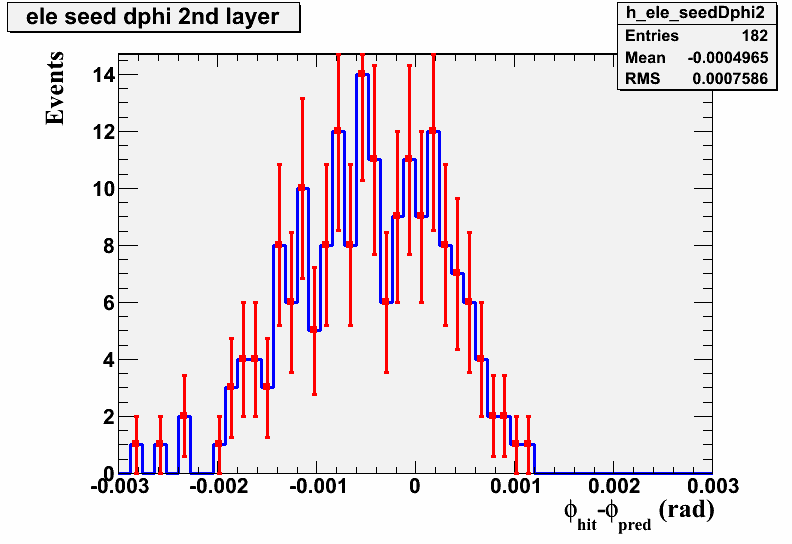
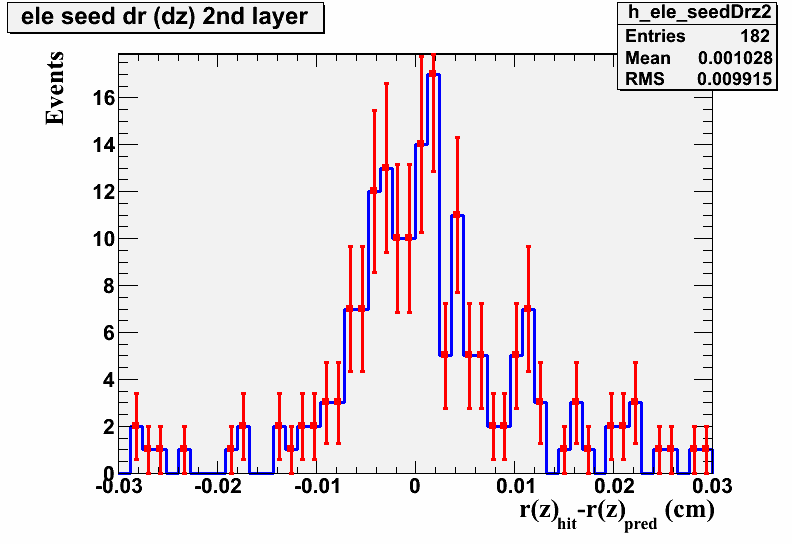
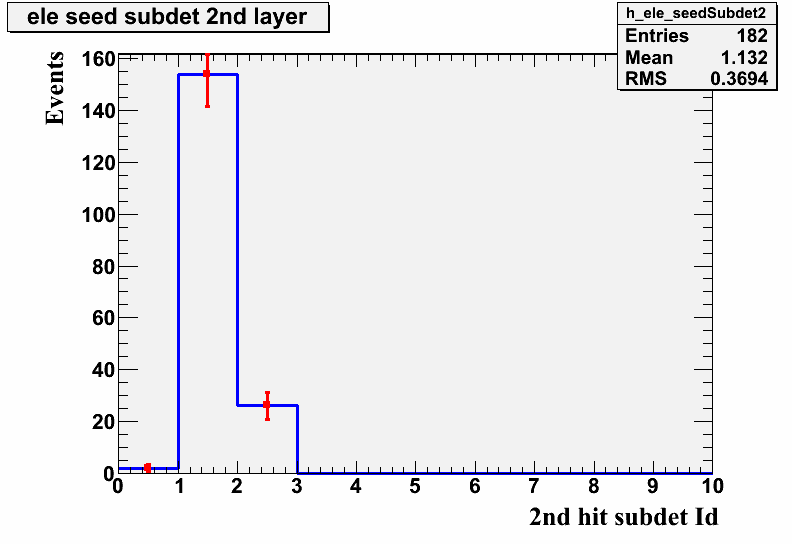
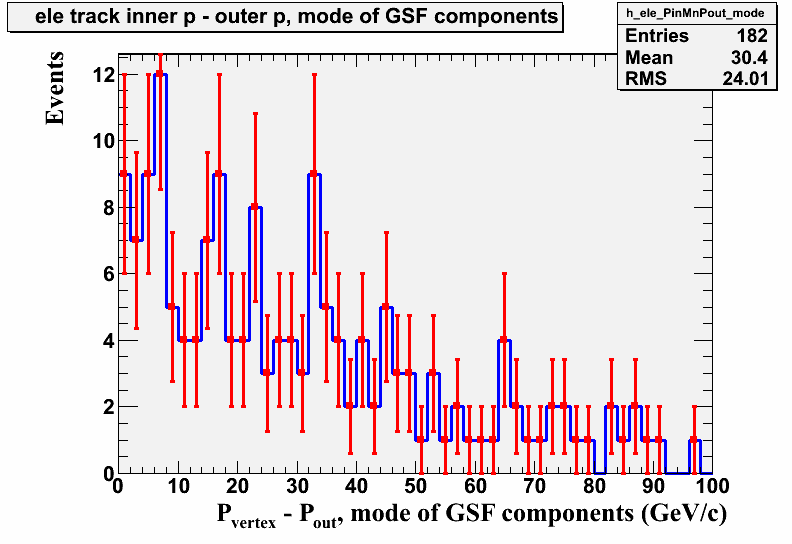
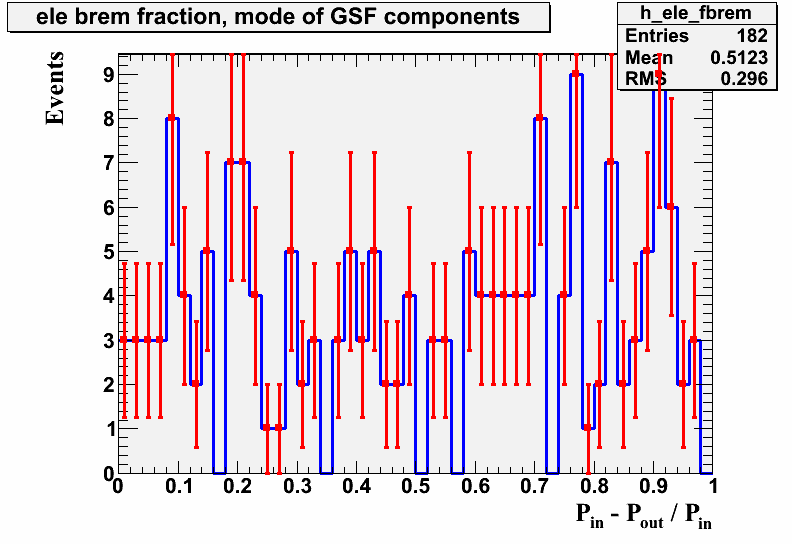
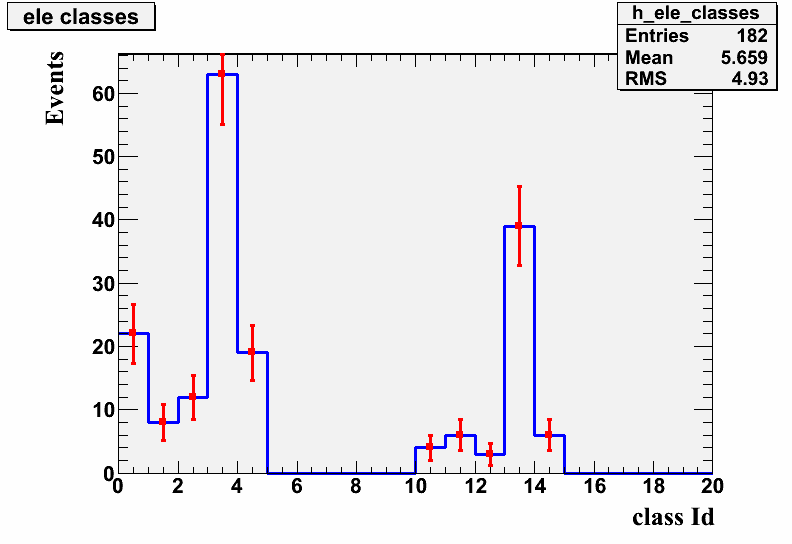
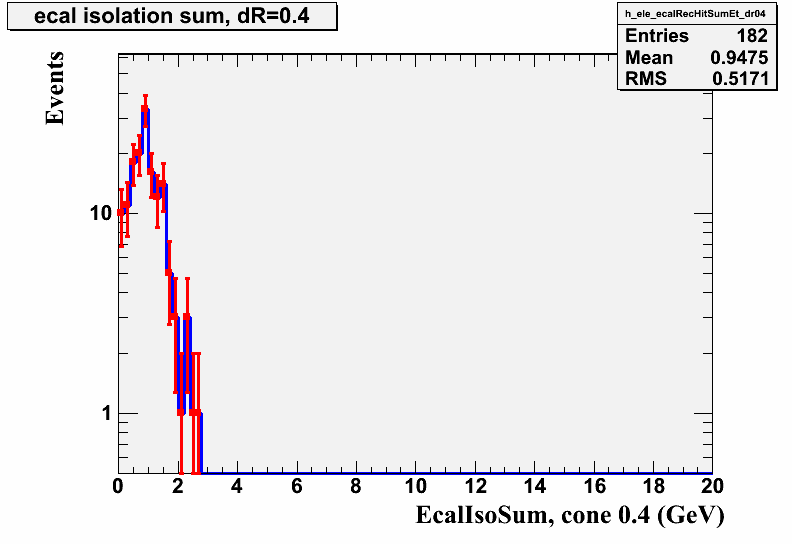
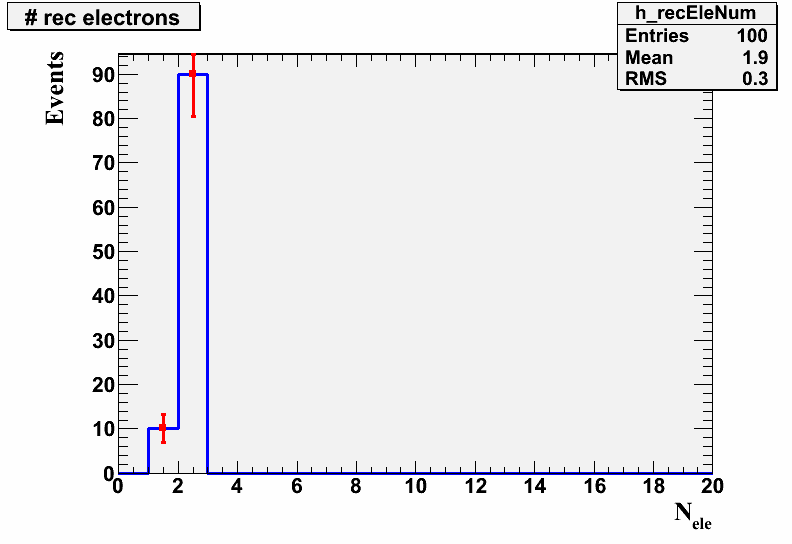
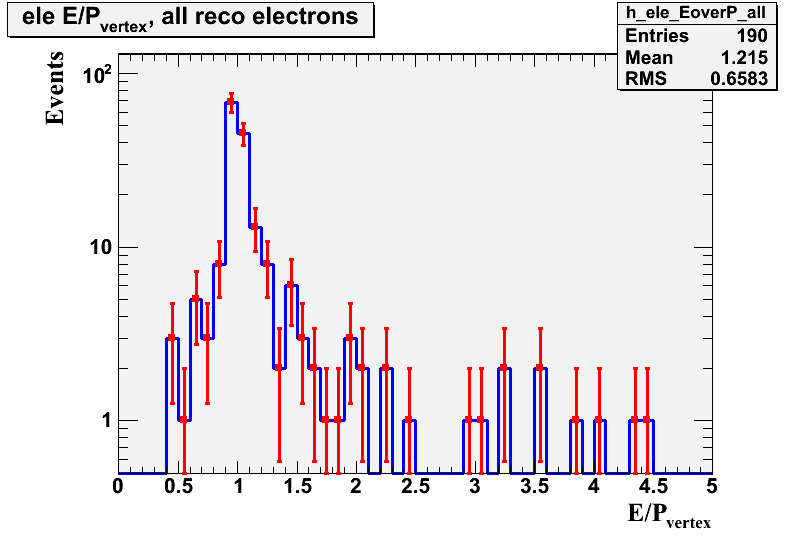
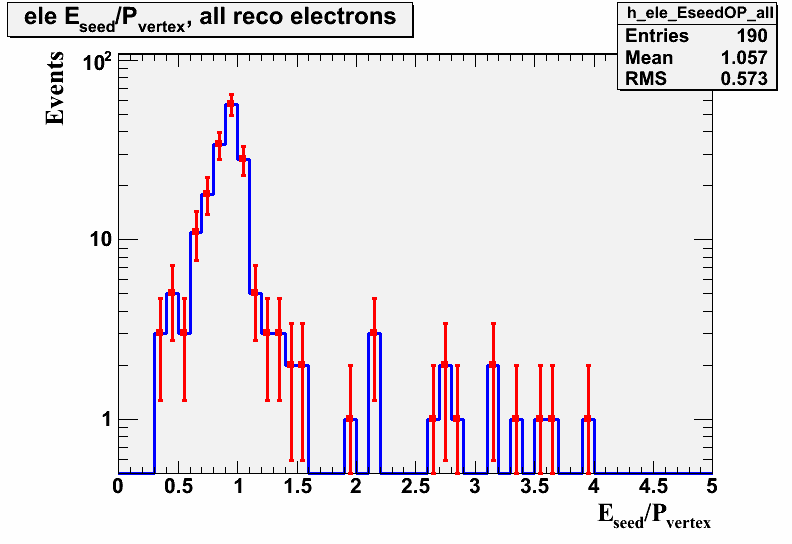
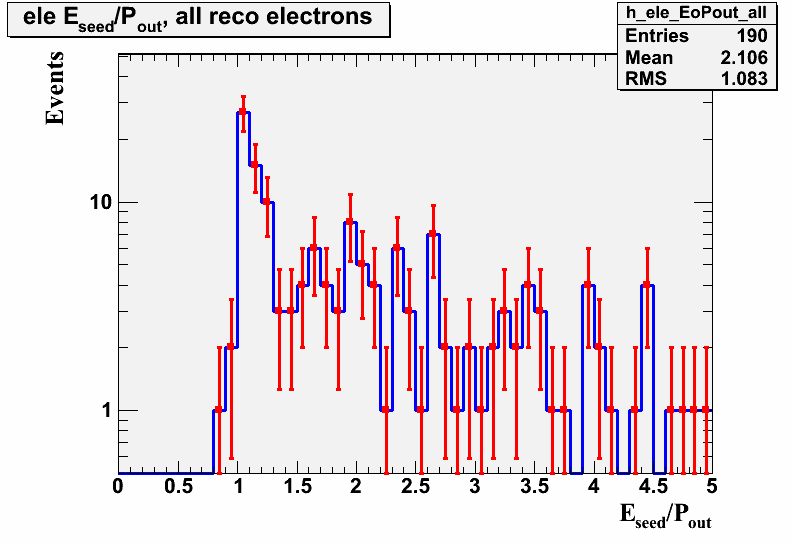
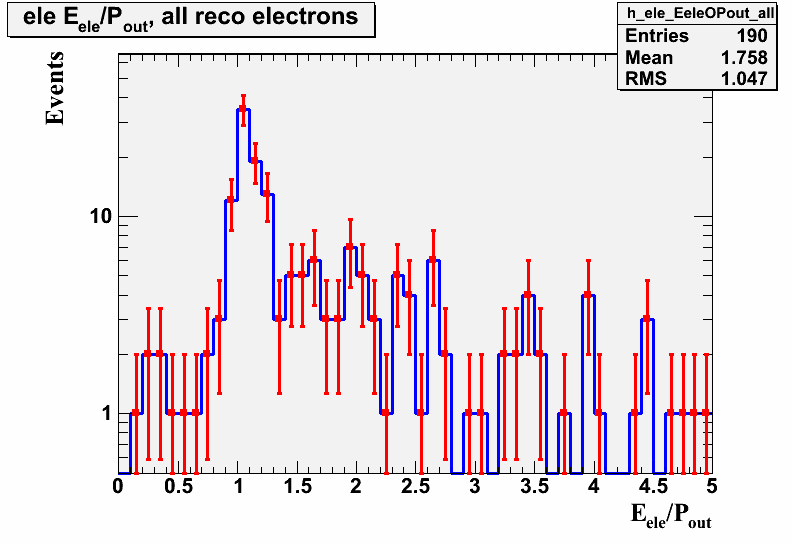
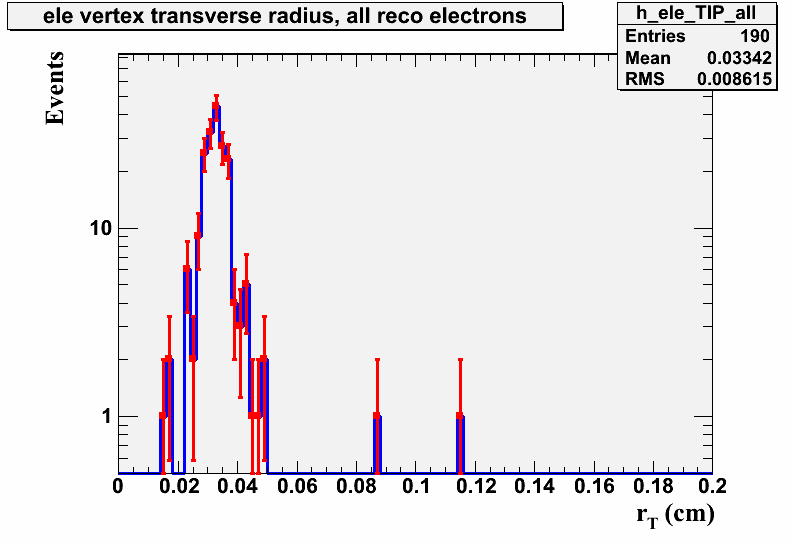
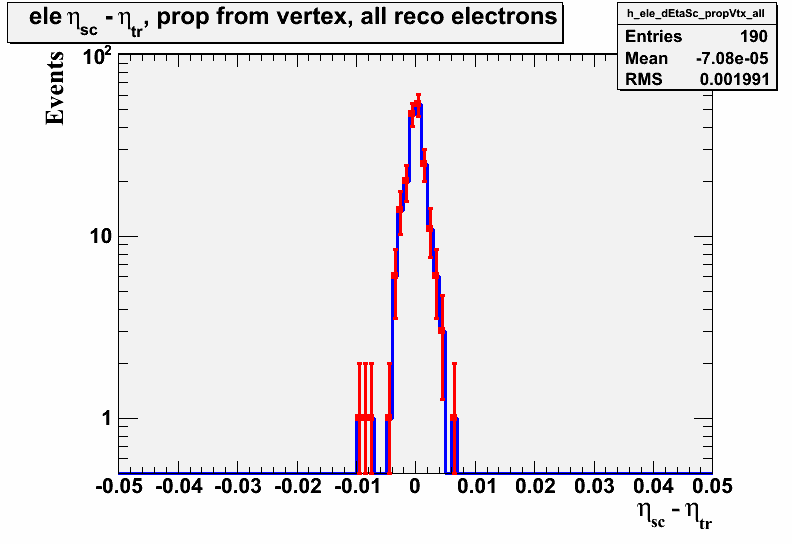
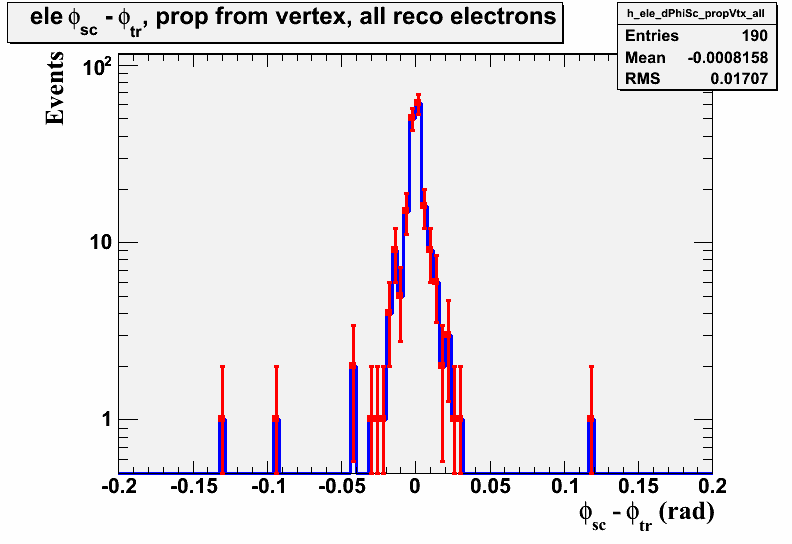
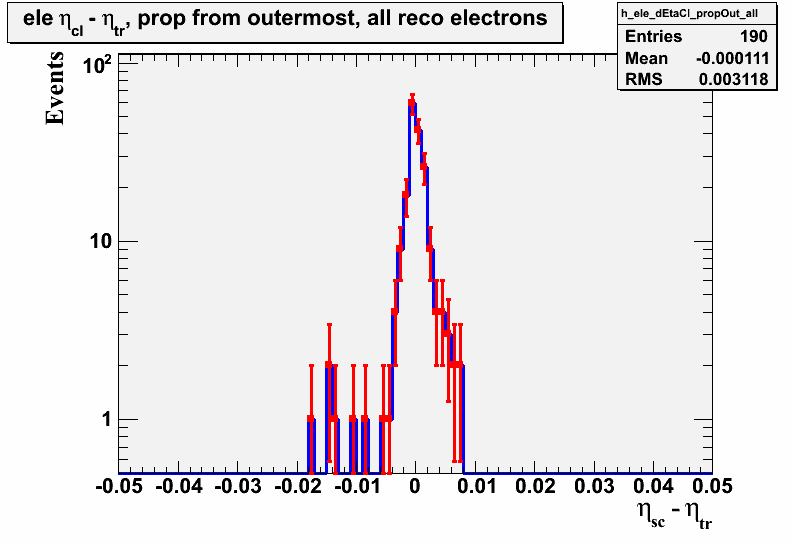
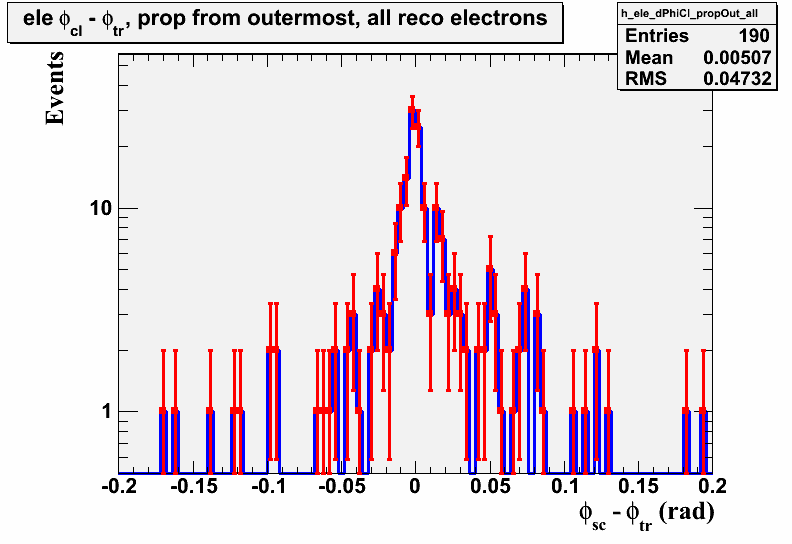
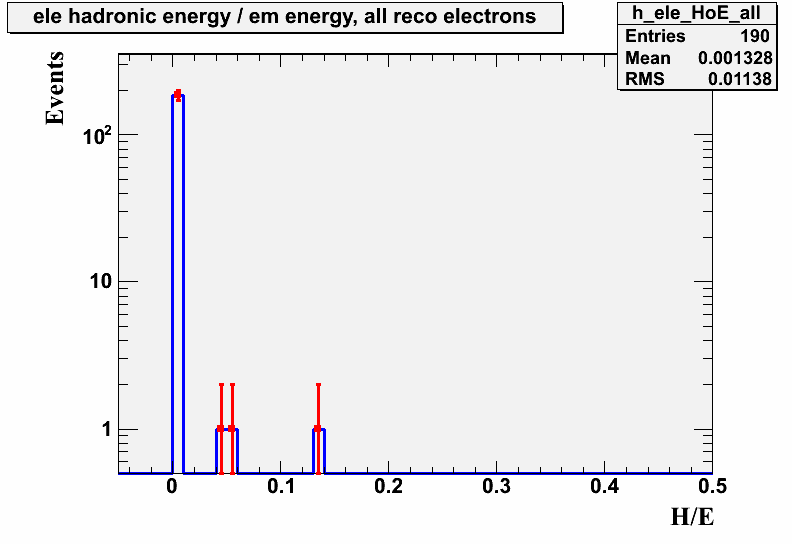
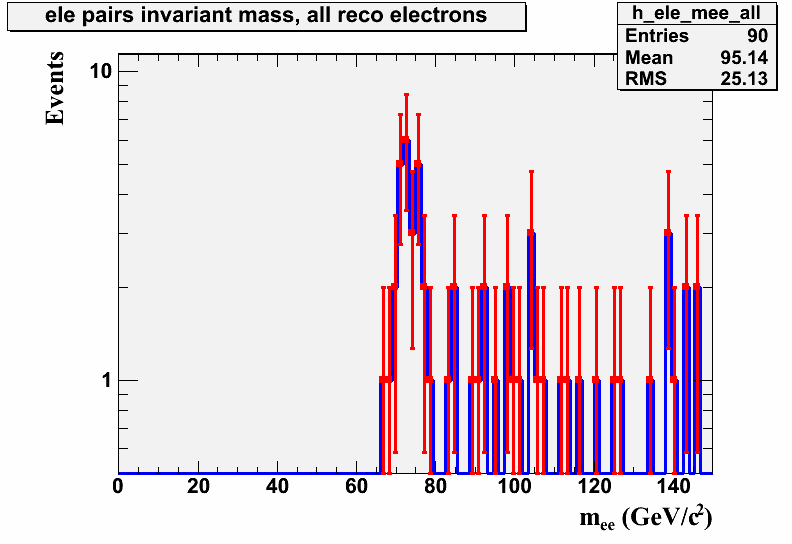
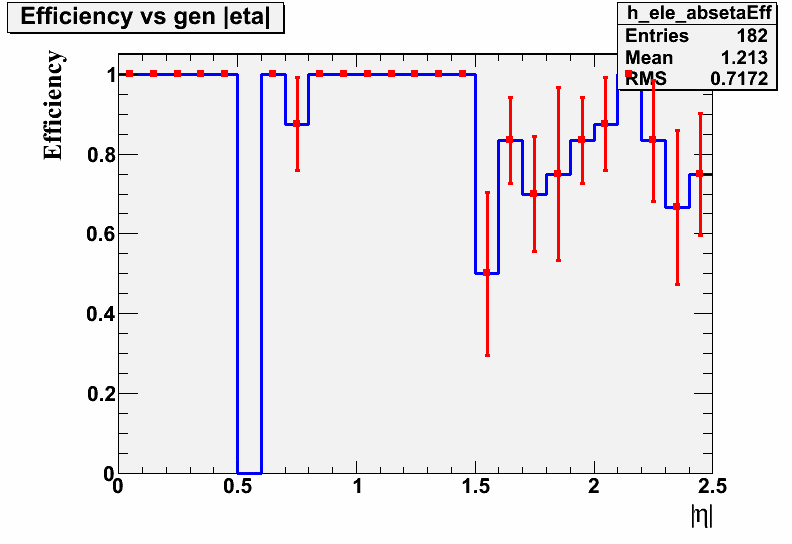
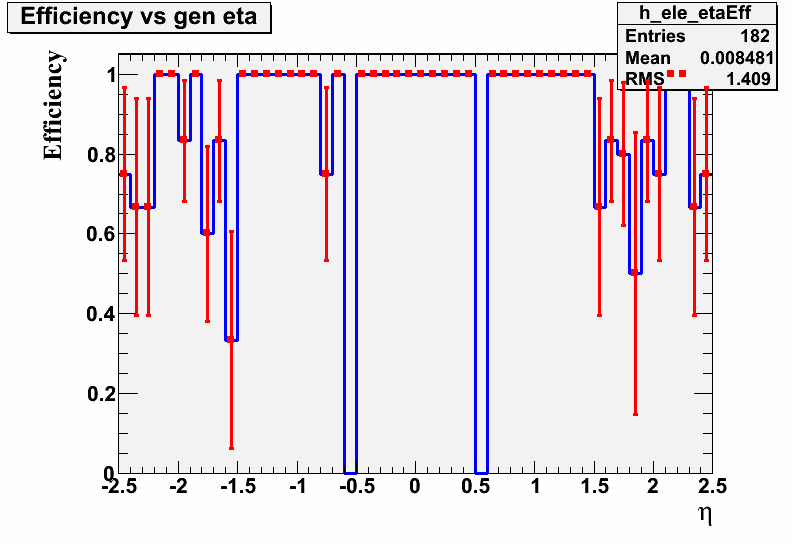
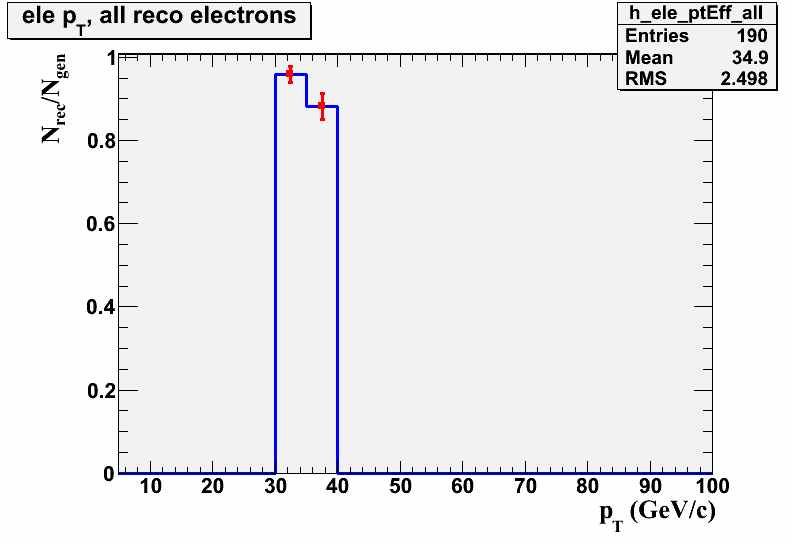
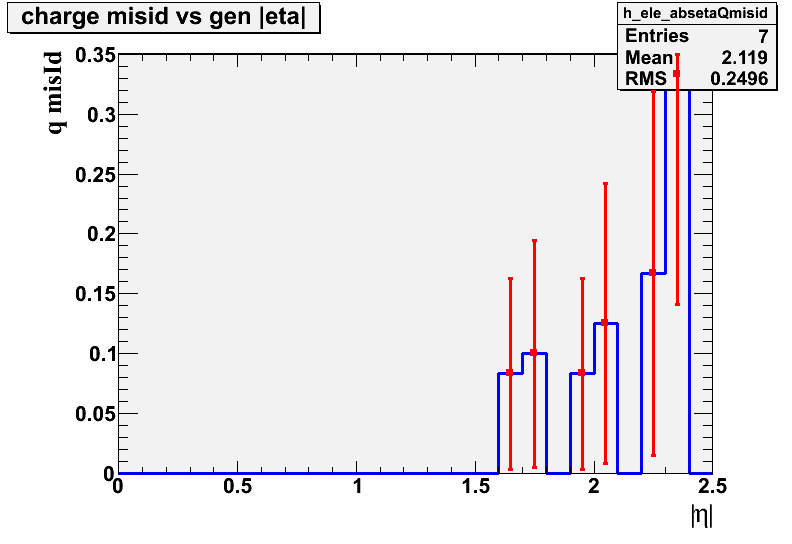
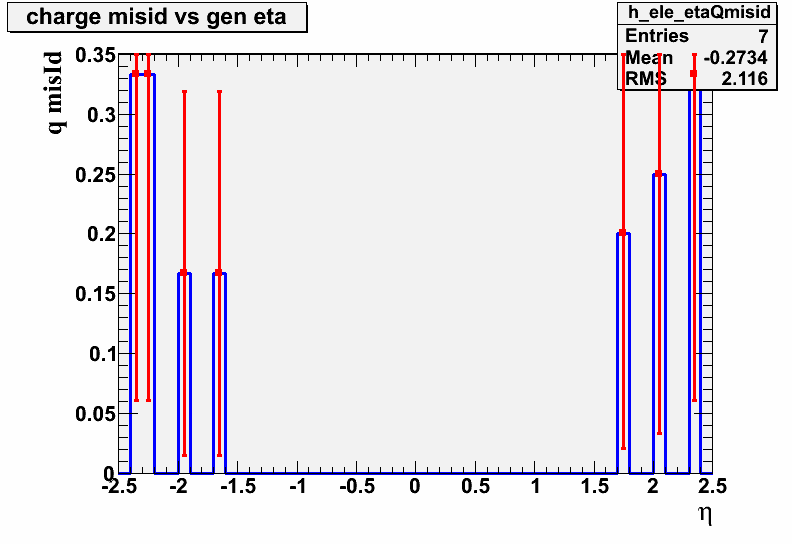
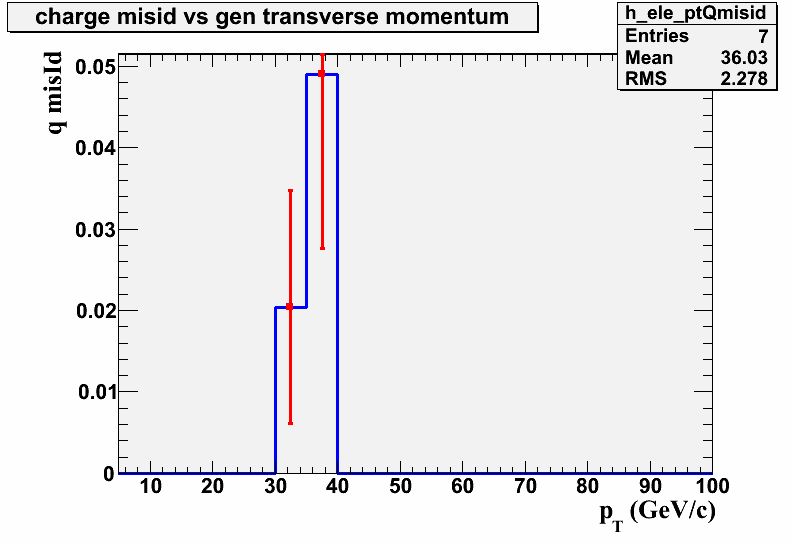
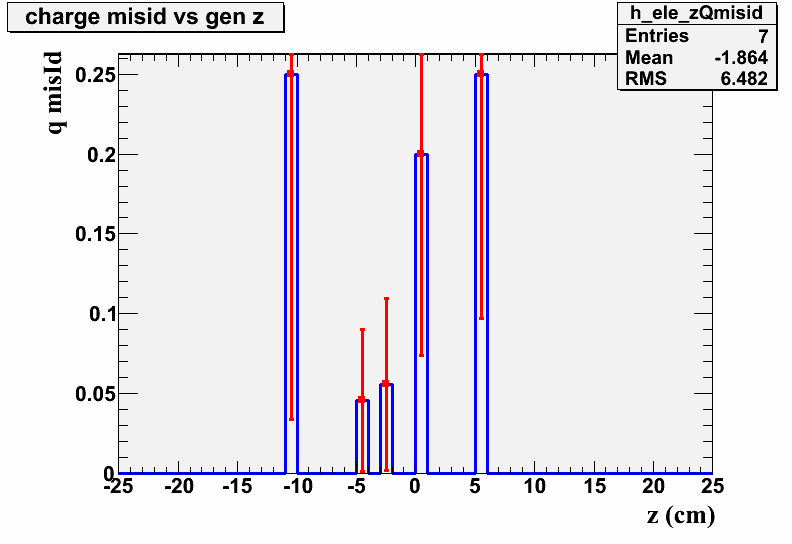
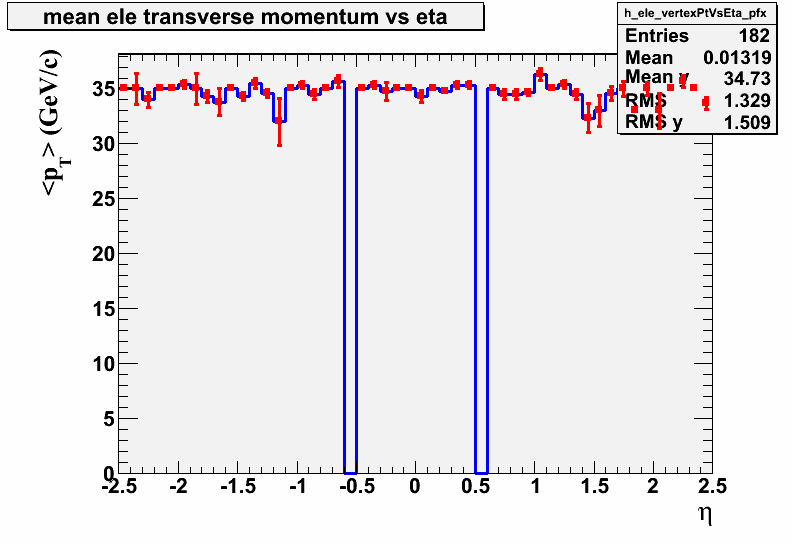
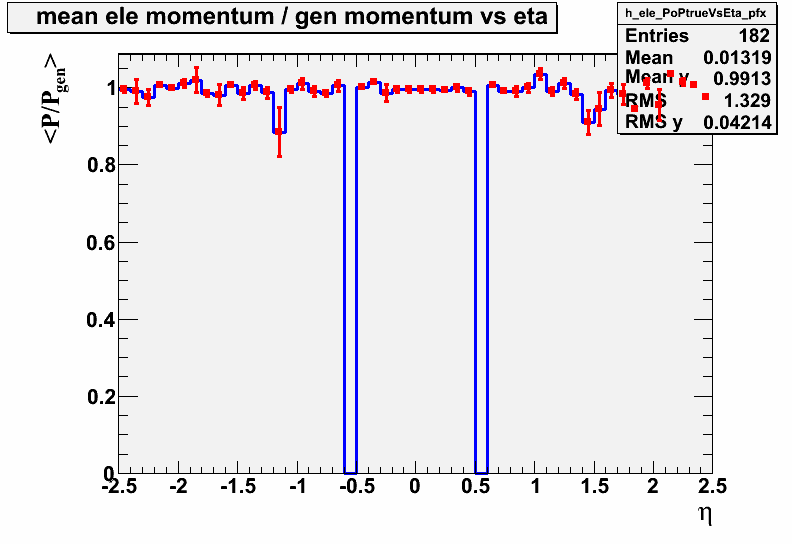
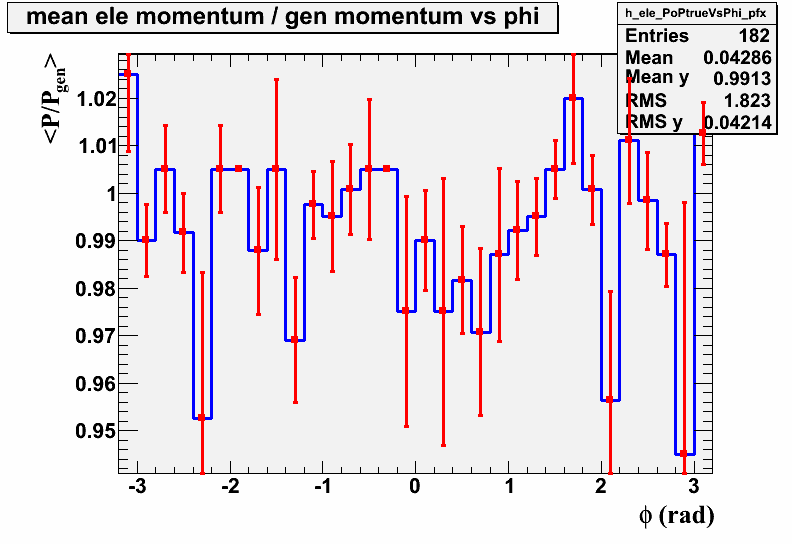
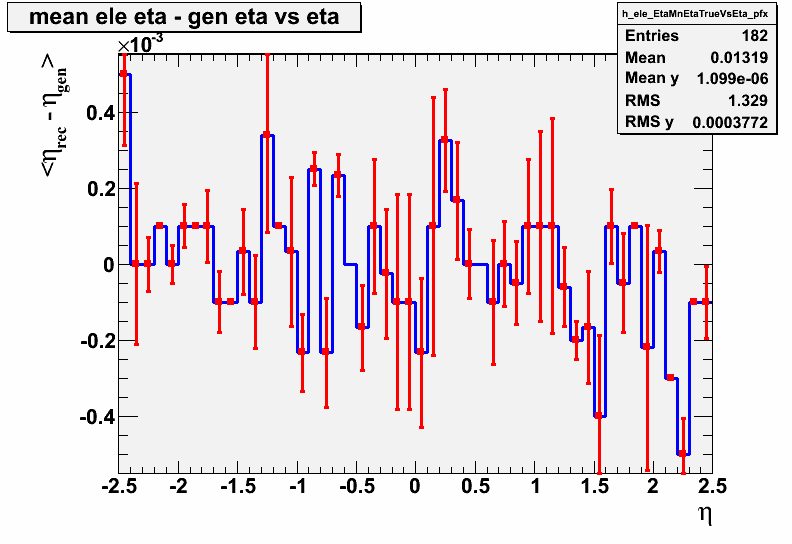
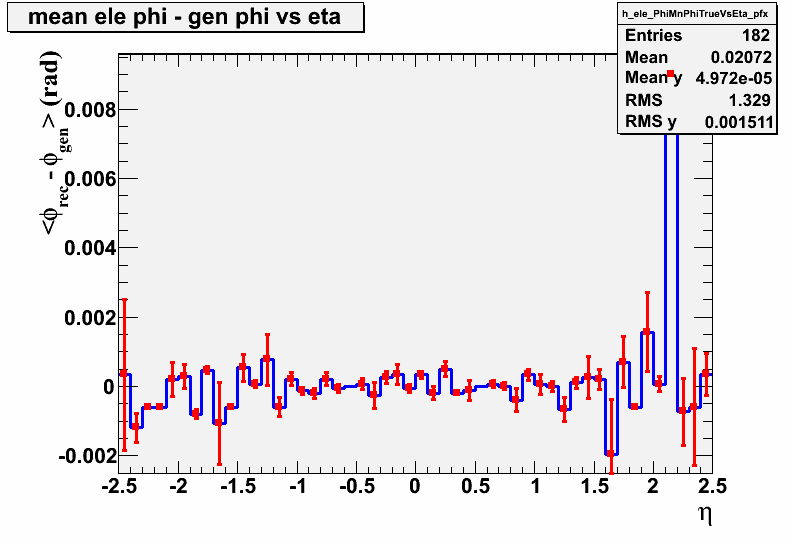
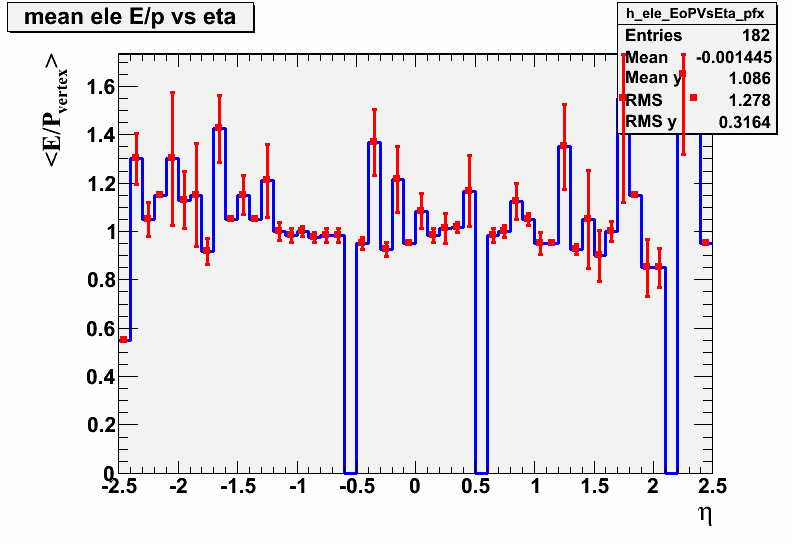
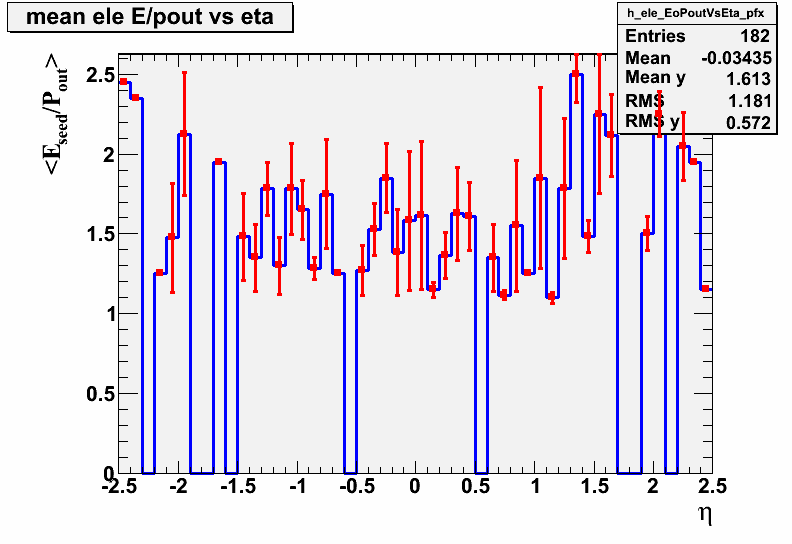
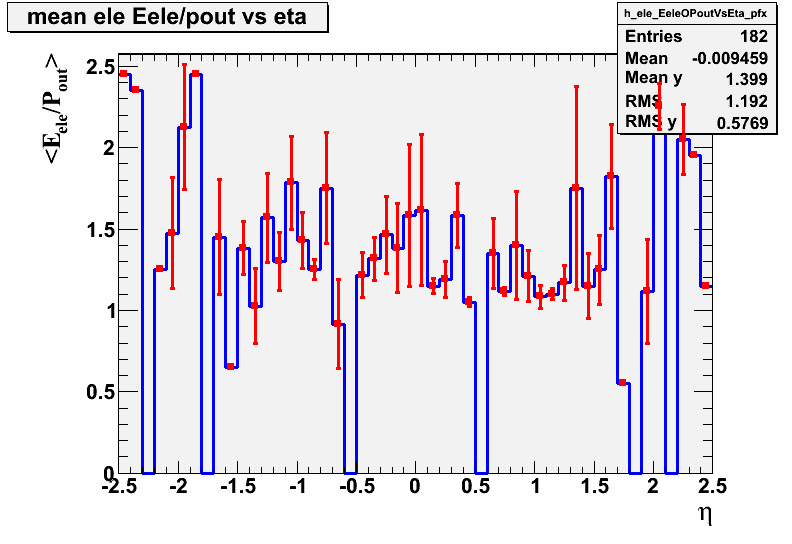
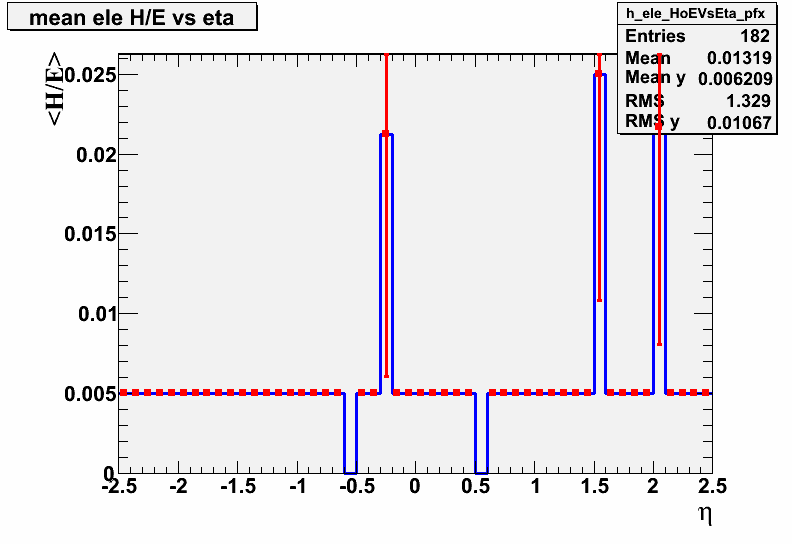
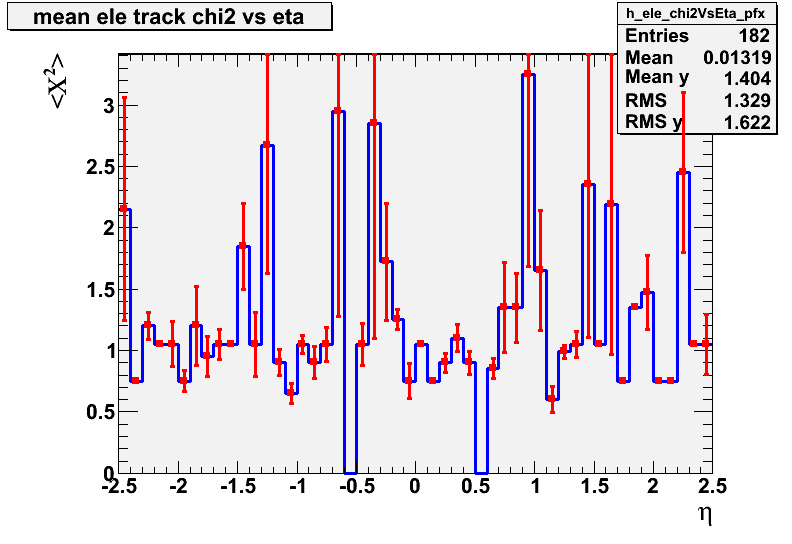
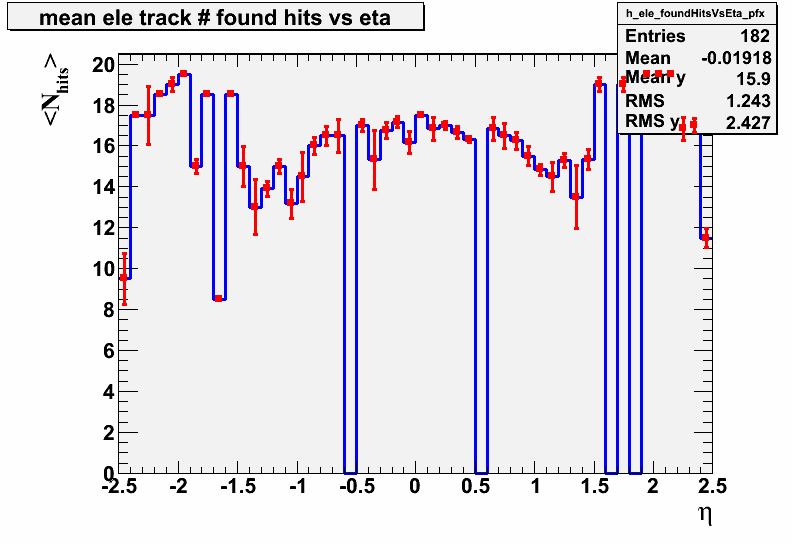
In all plots below, there 310pre10 histograms are in blue, and the 310pre10_5igmas histograms are in red.


No h_ele_ambiguousTracksVsEta_pfx for 310pre10.
No h_ele_ambiguousTracksVsEta_pfx for 310pre10_5igmas.