Run XSPEC: Part 2
|
3. XSPEC: Part 2 Also see: |
This is a continuation of Run XSPEC: Part 1, and it is assumed that you are still in the same session in which you ran Part 1.
Note: When performing spectral fitting with XSPEC, issues to consider are:
- The number of photons in the spectrum.
- The number of counts per bin
(and therefore the number of bins).
- The energy range that should be fit.
- The fitting statistic.
Procedure
Note: It is recommended that you use the search function of the XSPEC User's Guide for a more detailed explanation of the following examples.
- To rebin the plot, enter:
XSPEC12>plot

Tip: To see setplot options enter: setplot?
to see plot options, enter; plot?
- Enter:
XSPEC12>setplot rebin 1 2 |

- Enter:
XSPEC12>setplot rebin 2 10 |

- Enter:
XSPEC12>setplot rebin 2 5 |

- Enter:
XSPEC12>setplot rebin 5 5 |

- Enter:
XSPEC12>setplot rebin 5 10 |

- Enter:
XSPEC12>setplot rebin 5 5 |
- To perform a fit, enter:
XSPEC12>fit |
See Example: Fit 2.
- Since we have a small number of counts, we will use the C-statistic, enter:
XSPEC12>statistic cstat |
See Example of cstat result. For more information, refer to the XSPEC User's Guide.
- Enter:
XSPEC12>plot |

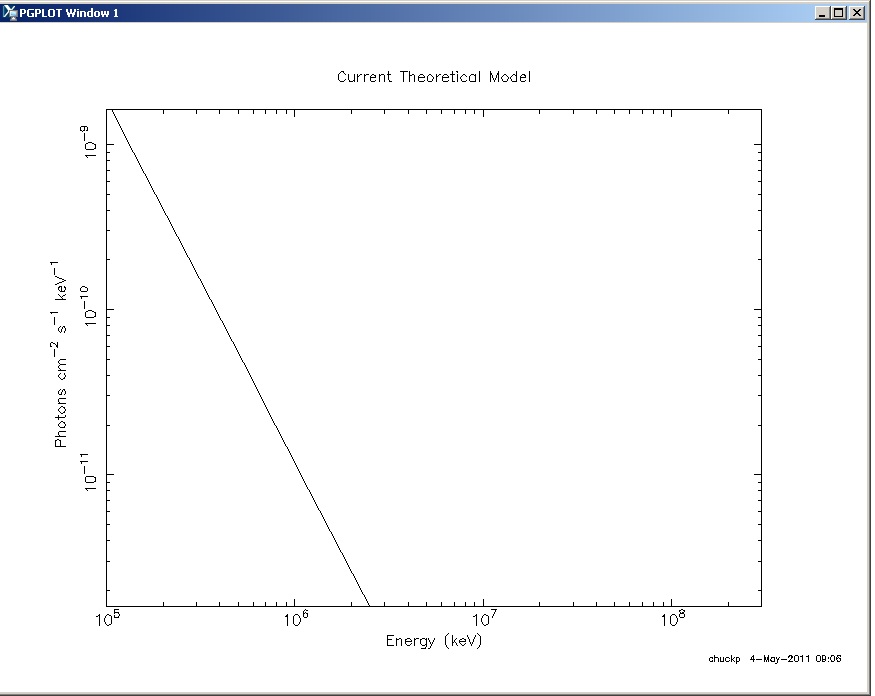
- To view the Theoretical Model, enter:
XSPEC12>plot mod |
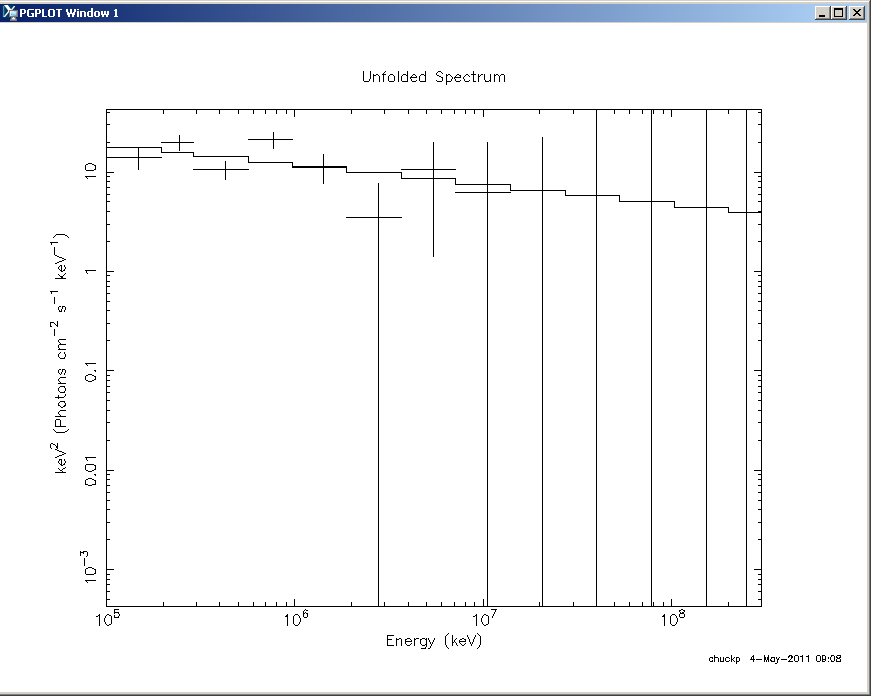
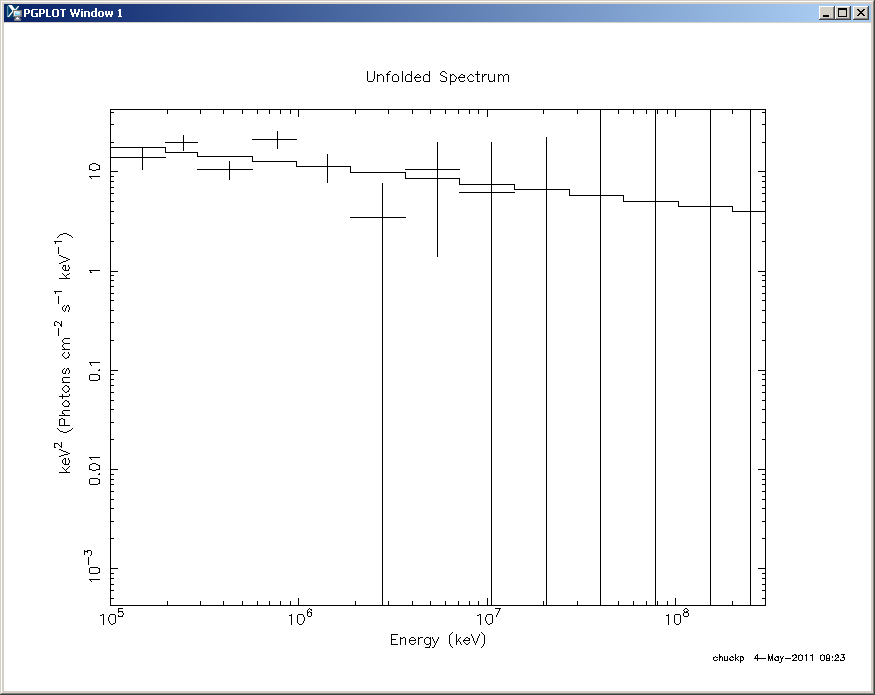
- To plot energy2 unfolded, enter:
XSPEC12>plot eeuf |
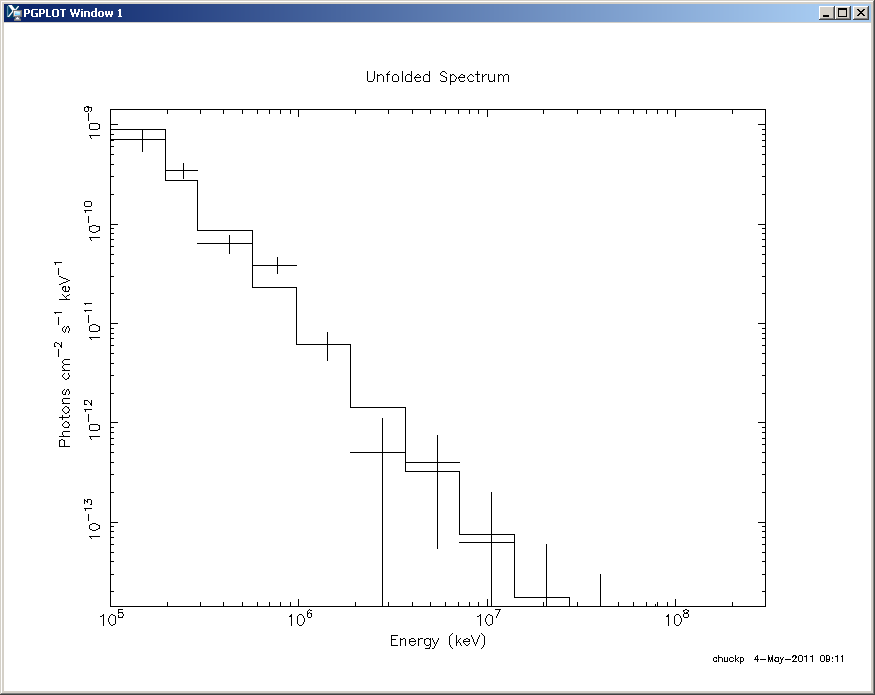
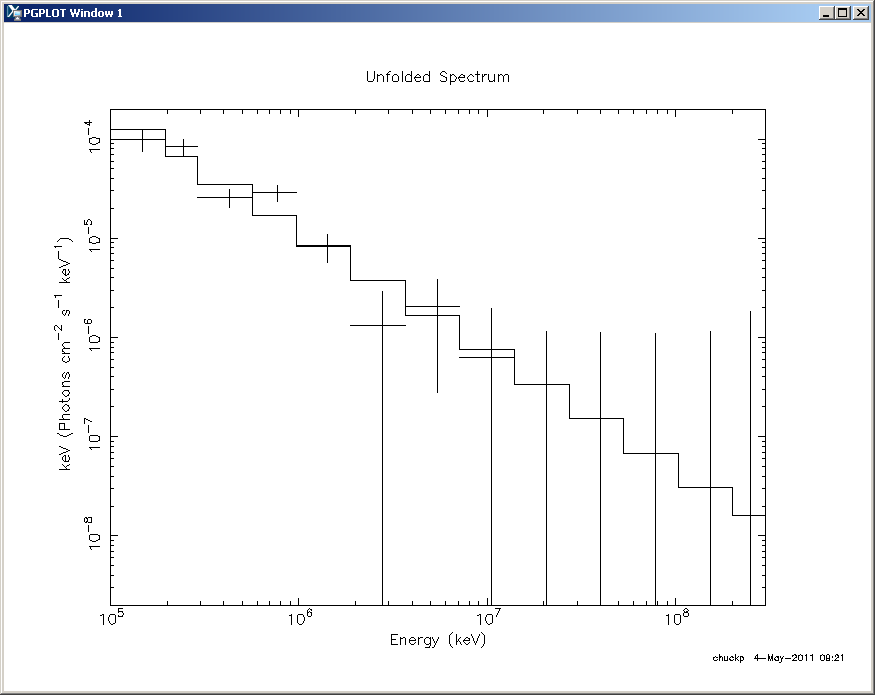
- To plot the unfolded model, enter:
XSPEC12>plot uf |
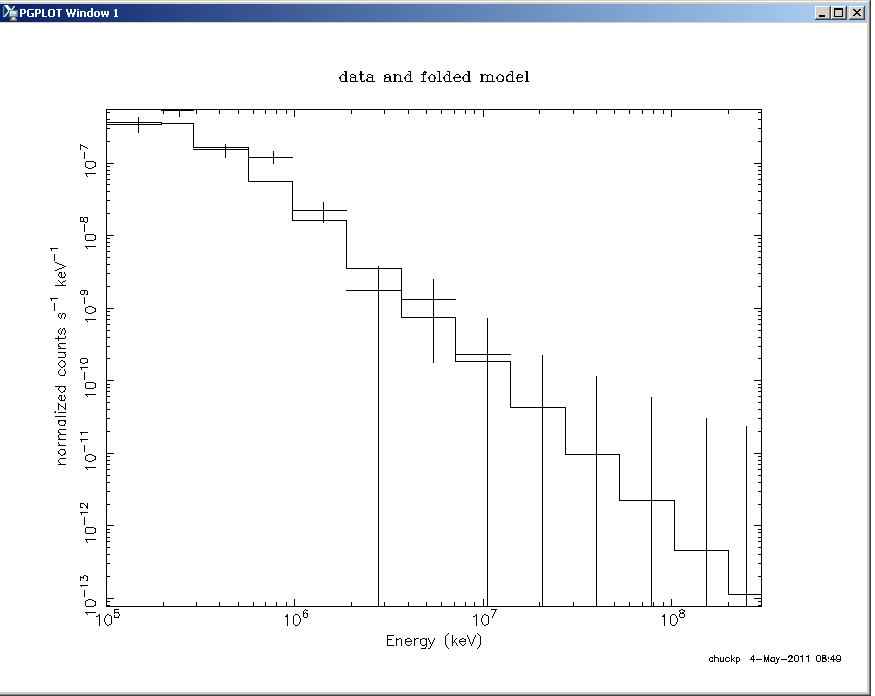
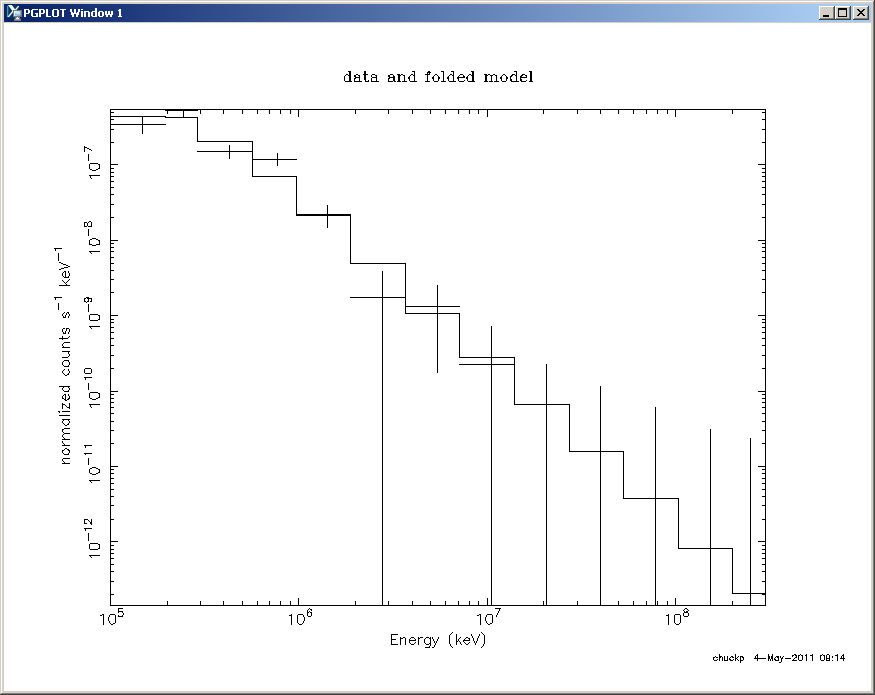
- To plot data and folded model, enter:
XSPEC12>plot ldata |
- Enter:
XSPEC12>plot uf |

- Enter:
XSPEC12>plot euf |
- Enter:
XSPEC12>plot eeuf |
- To calculate the flux, enter:
XSPEC12>flux 1 100 |
The result will be displayed:
and the requested range ( 1, 100 )
- Enter:
Model Flux 0.0001555 photons (1.1255e-07 ergs)/cm^2/s range (1.0000e+05 - 1.0000e+08 keV)
| Last updated by: Chuck Patterson 05/04/2011 |