Use Case II: Creating Histograms
Using ROOT's commands to improve the quality of the resulting plots
A number of settings can be used to make the plots that ROOT generates look better than the default. Here are examples of different commands:
Note: gStyle is one of ROOT's global variables used to control the overall settings for all plots.
gStyle->SetStatW(0.30);
gStyle->SetStatH(0.20);
gStyle->SetStatColor(42);
gStyle->SetOptStat(10);
Suppose t1 is a TTree*, then you can set the following:
t1->SetLineWidth(4);
t1->SetMarkerStyle(4);
t1->SetMarkerSize(0.5);
t1->SetMarkerColor(4);
t1->SetFillColor(5);
TKR
CAL
ACD
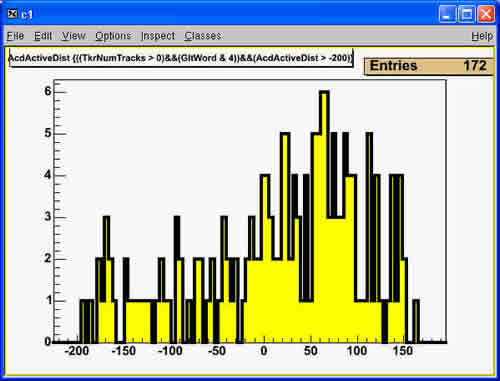
This use case will demonstrate looking at the ACD Active Distance Distribution.
- Start up ROOT and open the ROOT summary ntuple and access the ntuple TTree as demonstrated in Use Case I.
- Set up to create plots as demonstrated in Use Case II .
- Create the TCuts to be applied when creating the new histogram.
In this case, we wish only to keep those events that had:
- 3-in-a-row in the TKR (GltWord & 4)
- An Active Distance value over -200 (AcdActiveDist >-200)
- At least one reconstructed track (TkrNumTracks > 0)

- Now create a 1-Dimensional Histogram for ActiveDistance using the command:
t->Draw("AcdActiveDist", trackCut && threeinarow && goodActiveDist)
This should produce a histogram simalar to:
Owned by: Heather Kelly
| Last updated by: Chuck Patterson
02/11/2005 |
|
|