Help: LAT Data Processing Monitor
Launch:
On this page: |
![]() From the GLAST Data Processing monitoring tool, you can directly access or drill down to all of the pertinent information generated by the LAT data processing chain. To a degree, the Daily Operations Flow Diagram provides a context for understanding the data processing chain.
From the GLAST Data Processing monitoring tool, you can directly access or drill down to all of the pertinent information generated by the LAT data processing chain. To a degree, the Daily Operations Flow Diagram provides a context for understanding the data processing chain.
 |
After logging in:
- Click on Selection.
The following fields will be displayed:
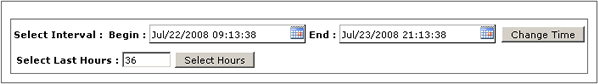
- Select the Time Interval (i.e., Begin and End, or Last Hours), and then click on the Change Time or Select Hours button.
 |
- Click on Summary.
Things to check. When monitoring science data production, things to check include:The data processing summary for the time interval selected will be displayed.
Note the Refresh Rate: The GLAST Data Processing monitor does not refresh automatically. Set the refresh rate (e.g., 30 secs), and then click on the Start Refreshing button:
- FASTCopy Incoming/Outgoing.
- Data Processing Status.
- Data Quality.
- Data Product Deliverables:
- ASP results
- Number of GRB alerts sent.
- Position and preliminary light curves of transient sources.
- LAT performance metrics:
- Hit multiplicities.
- Fraction of reconstructed events.
- Tomography to identify detector elements.
- Coarse distribution of residuals to look for misalignments
- Average properties of bright pulsars to look for misalignments or calibration.
- ASP results
Deliveries/Runs processing status
Delivery Columns: Id and Time
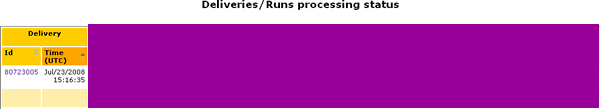
Delivery Id. When LAT science data is received from the MOC, a Delivery Id (also known as the downlinkID) is assigned during the FASTCopy, Raw Archive Ingest to all top-level pipeline processing streams, making it possible to ensure that all data received is successfully processed (or otherwise accounted for) and made available as appropriate to:
- collaboration members via the ISOC's data server, and to
- collaboration members (and – after the first year of operation – to the scientific community at large) via the GLAST Science Support Center (GSSC).
The nine digit downlink identification number, which is assigned to playback data (e.g., 080723005) downloaded from the observatory, is in the format YYMMDDNNN, with the leading zero suppressed:
| YY | = |
Year (Leading zeroes are suppressed.) | |
| MM | = |
Month | |
| DD | = |
Day | |
| NNN | = |
Transfer package number |
Delivery Time is the Universal Time Coordinated (UTC) date and time that the tarball was received at the ISOC from the MOC (e.g., Jul/23/2008 15:16:35).
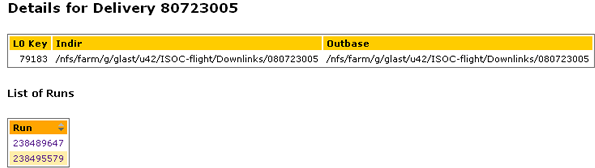
When you click on the Delivery Id number in the firt column, the Details for Delivery will be displayed, including the Indir(ectory), the Outbase directory, and the List of Runs:
FASTCopy Columns: Proc(ess) and Logs
Note that, when data is being tracked from "delivered" (i.e., FASTCopy IN) through the processing to delivery (to the GSSC), the FASTCopy outgoing number is the same as the Downlink Id, except that it is split into two parts, e.g., 80723_c005. (See Level 0 Event Data Processing.)
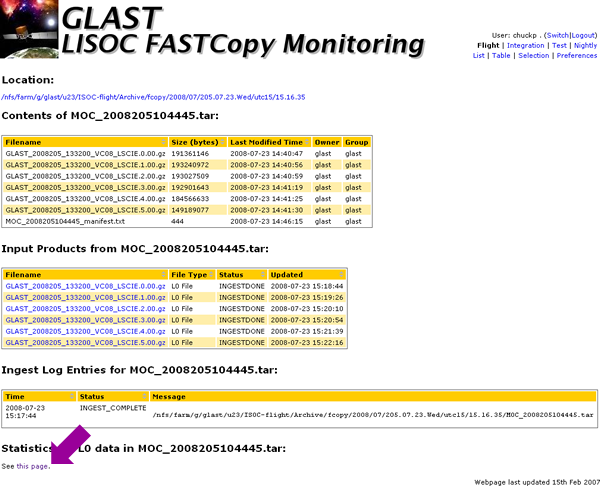
Tip: Click on the "See this page" link to view the the Total Packet/Bad Packet, Gap, and Timing distributions for the tarball.
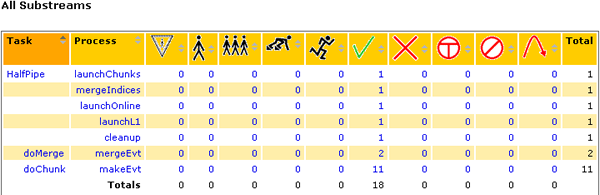
HalfPipe Column

When you click on the HalfPipe progress bar, the details of the Halfpipe stream, including Variables, Stream Processes, and Substreams are displayed.
Tip: In the event of a failure, you can drill down to the All Substreams display and check in the red "X" column to determine which process failed.
Note: There were no failures in the example shown below:
Runs, L1Proc, and GRB Search
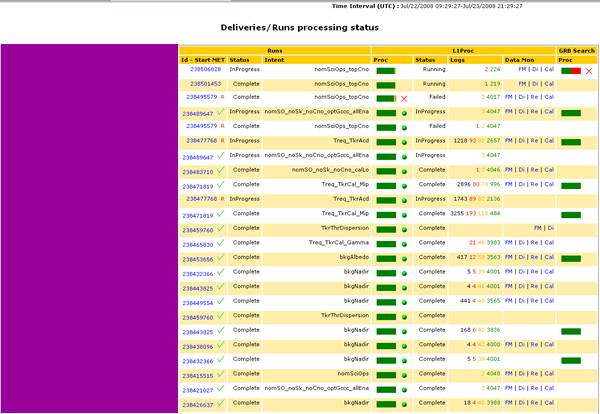
- Green = Complete
- Gold = Processing
- Red = Problem
Tips:
- Click on the respective progress bars to drill down for details of each process shown.
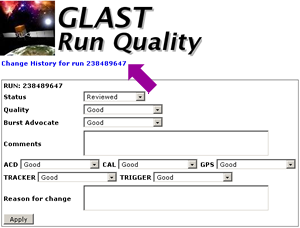
- Run Quality:
- A red "R" in the Runs Id - Start column indicates the run is "waiting review".
- A green check mark
 indicates the Run has been reviewed.
Click on the green check mark to view the details and comments:
Note: Click on the change history link to view
the Run's history.
Things to Note:
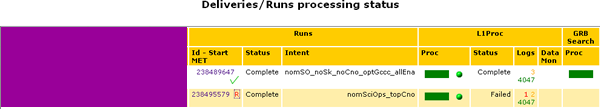
- ID - Start MET = Trigger start time of acquisition (in seconds) from the beginning of the LAT epoch (midnight, January 01, 2001 UTC) as captured onboard the LAT.
- Data Quality Monitoring (DQM). Towards the end of L1Proc for each run, DQM links start to appear for:
- FM
(FASTCopy Monitor)
- DI
(Digi)
- Re
(Recon)
- Cal
(Calibration)
- Failures (X). Links in column entries enable you to quickly drill down to detailed information about each delivery.
For example:
If you hover over a color-coded process status bar (e.g., FASTCopy, HalfPipe, or L1Proc), a percent completed message is displayed.
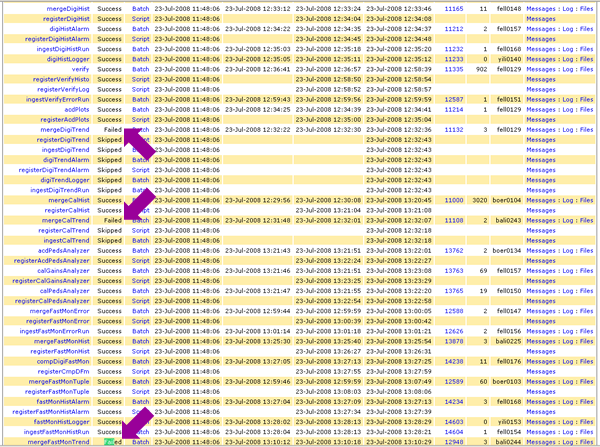
In the following example, 80723006 had two failures, 238506828 and 238495579, as indicated by the large red Xs, and by the red bars in the Proc columns for the GRB Search and L1Proc status bars for the GRB Search Proc(ess):
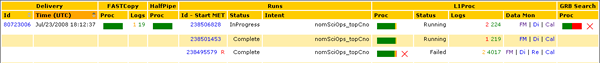
To drill down, one would click on the Proc status bar (e.g., GRB Search) and find that the Pipeline's blind_search task failed during the L1Proc task for this run. (Note the "1" in the failed (X) column below:
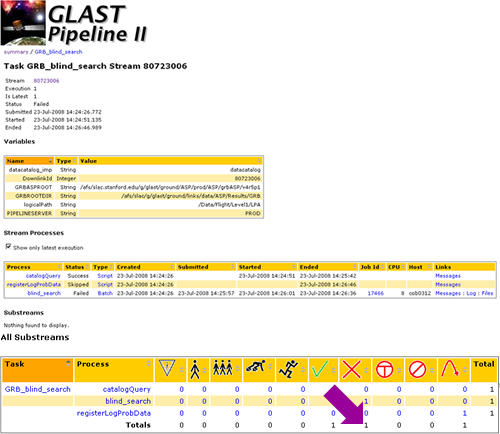
Note: A similar drilldown initiated by clicking on the Proc status bar for the 238495579 L1Proc failure noted above revealed multiple failures, each one associated with a merge... process:
At this point, since there is no Rollback option, you would probably want to contact an expert.
Rollback Option
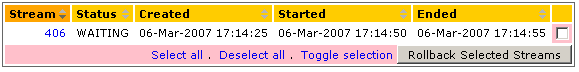
In some cases, however, you may drill down to a failed process which displays a Rollback option, enabling you to select the failed task streams and reprocess them by first selecting them, and then clicking on the Rollback Selected Streams button:
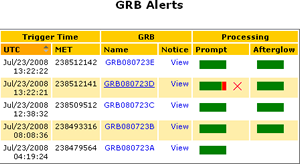 |
GRB Alerts
As shown at right, the GRB notice display enables you to track burst alerts input to the GRB database table:
- UTC/MET is the notice issue time expressed as GLAST's Mission Elapsed Time in seconds, beginning midnight (00:00:00) January 01, 2001 Coordinated Universal Time (UTC).
- The GCN Universal Name for a Gamma-Ray Burst is: GRB YYMMDDX, where "X" designates the order in which a burst is detected to allow for those cases when more than one burst may be detected in a single day.
Things to Note:
- A processing error occurred for GRB080723D, therefore no light curves or counts maps are available when you click on the name link.
However, when you click on the Proc status bar, the Task GRB_refinement Stream238512141, Stream Processes, and All Substreams summaries are displayed. When you scroll down to All Substreams and examine the Failed (X) column, you find that the extractLatData process has failed:
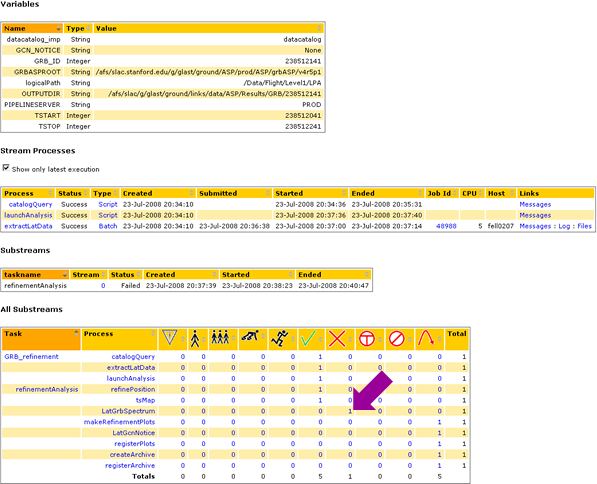
At this point, since there is no Rollback option, you would probably want to contact an expert.
|
Note that, when you click on the View link, you will get a GCN/GLASTNOTICE readout (see below), and periodic updates:
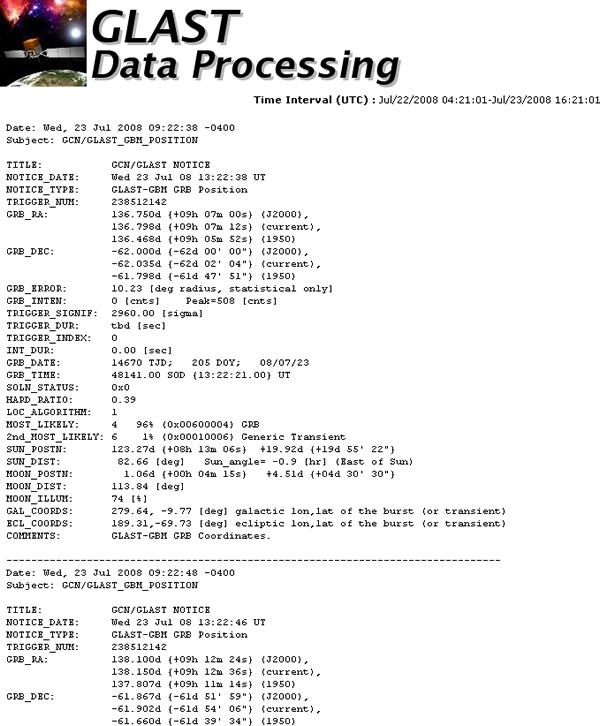
|
And, when you click on the GRB Name (e.g. GRB080723A), the ASP Data Viewer (see below) is displayed for GRB: 238479564.
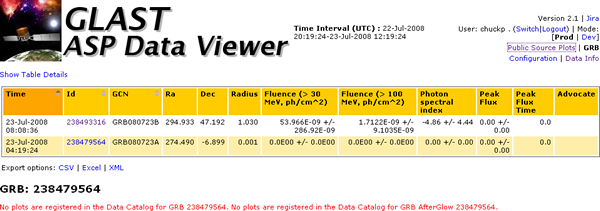
Note the message in red stating that "No plots are registered for GRB: 238479564...."
 |
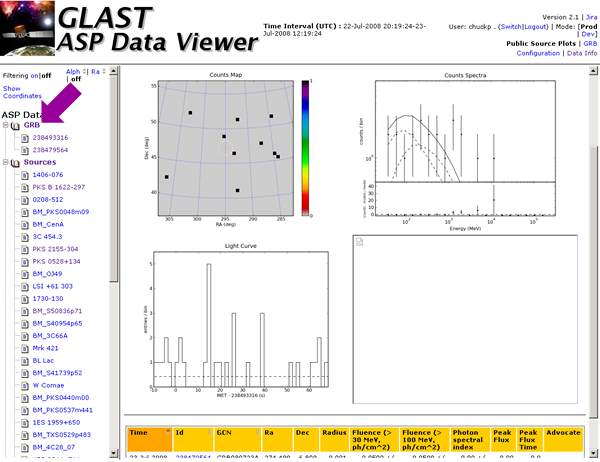
However, if you now click on "Public Source Plots" and then (in the top of the left column of the new display) click on "GRB", the plots of the Counts Map, Counts Spectra, Light Curve, and Energy will be displayed for GRB: 238493316:
ASP Sky Monitor Process
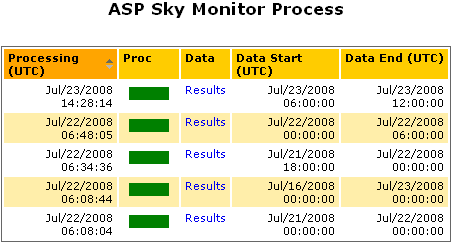
As shown below, the ASP Sky Monitor enables you to quickly view the "Results" of a GRB Burst (e.g., 14:28:14):
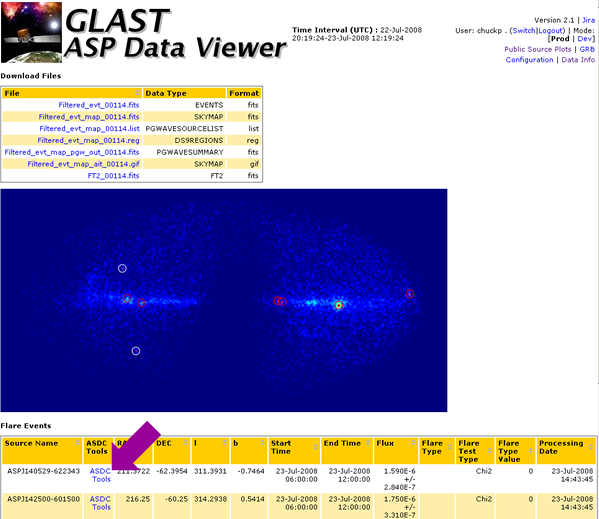
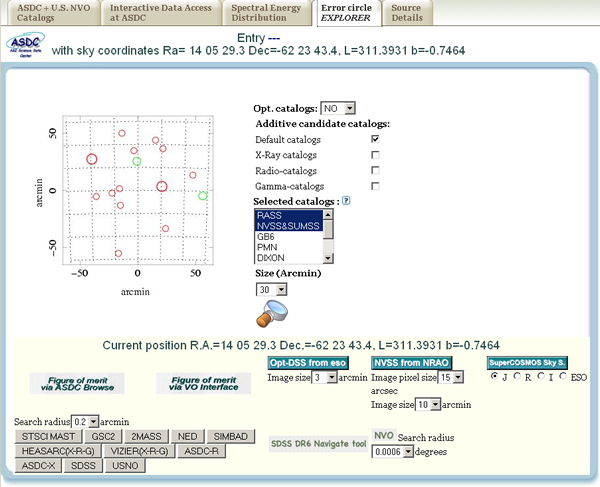
Click on the ASDC Tools link for the source name you are interested in; an interactive GUI similar to the following will be displayed in a popup window:
Last updated by: Chuck Patterson 10/16/2007 |