GLAST Pipeline Frontend (PFE)
The GLAST Pipeline Frontend enables you to monitor the progress of jobs in the pipeline, access the batch and system logs for an individual job, and drill down to retrieve an individual file in order to determine what happened during a run. It also enables you to filter different tasks using a key word common to a set of task names. This feature is also useful in determing run ranges, run date ranges, etc.
- Click on: GLAST Pipeline.
A page similar to the following will be displayed:
Note: In the upper right section of this page, you can view the usage data for each of the three pipeline applications [Prod | Dev | Test] similar to that shown below by clicking on: Usage Plots.
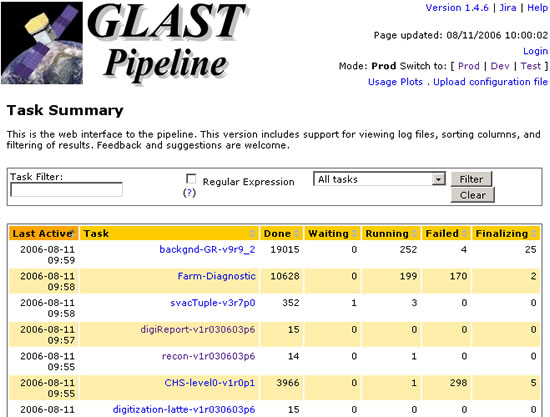
- To view only Beam Test production runs, click on Prod.
- When monitoring runs:
- In the Task Filter data entry box, enter the version number of the beamtestPipeline
(e.g., v1r030603p6); then click on: Filter.
As shown below, tasks such as recon, reconReport, etc., are displayed in the "Task" column.

- Look at the summary of a task to ensure that none of the tasks appear in the "Failure" column.
At the time this image was captured: 14 recon tasks were done; 1 was running; 0 had failed, and 4 configReports were finalizing.
Note: For definitions of the subtasks being peformed within each task, refer to:
https://confluence.slac.stanford.edu/display/BeamTest/Beam+Test+Pipeline
- If a Failure occurs (as happened, for example, in v1r030603p5 shown below):
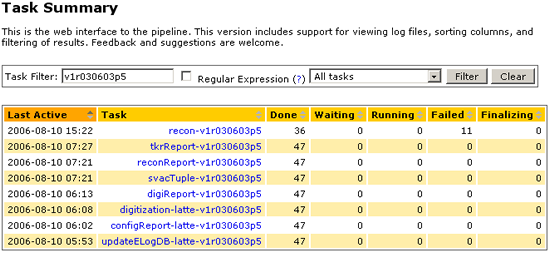
- Click on the failed task (e.g., recon-v1r030603p5) to view the summary for each of its subtasks:
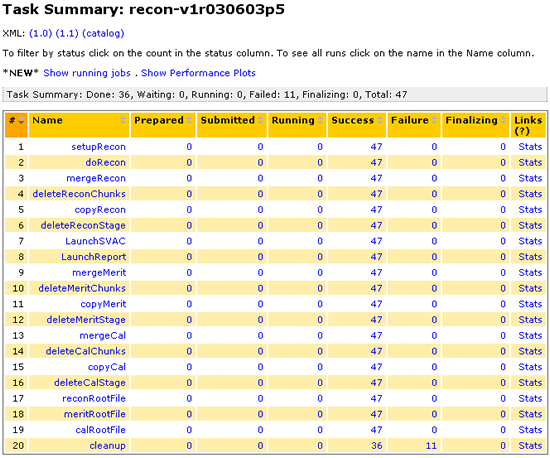
Notes:
- 11 failures occurred during the 'cleanup' subtask. (Reportedly, these were caused by "incorrect deletion of previous chunks").
- To view the cleanup performance plots, click on "stats" in the "Links" column. (Observe that, immediately above the task summary table, there are also links enabling you to show "running jobs" and "performance plots" immediately above the table; at the time of this writing, no jobs were running.)
- Identify the Run numbers that failed. To view the cleanup process for the failed runs, click on the number 11 in the Failure column.

- Notify all designated personnel of the failures; provide them with the run numbers that failed and the version of the pipeline.
- Continue investigating. From the 'Links' column, you can view the log files for each of the failed runs.
Notes:
- The "Log" link provides access to the user process log file generated by the batch processor.
- "Out" and "Err" links provide access to the system system logs generated by the pipeline software that support the users' batch runs.
- The "Files" link provides access to an FTP Index, from which you can download the files used by - or generated during - a batch run.
| Last updated by: Chuck Patterson 08/22/2006 |