Resource Monitors: Nagios, Server
Monitoring, & Ganglia
There are three primary monitoring tools for the Science Analysis Systems software infrastructure: Nagios (currently available only at SLAC), the tomcat Server Monitoring tool, and Ganglia (for monitoring glast domains, including: glast-oracle, glastlnx, nfs-glast, and glast-xrootd).
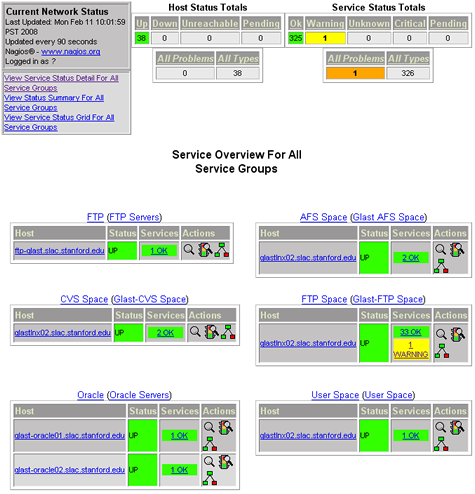
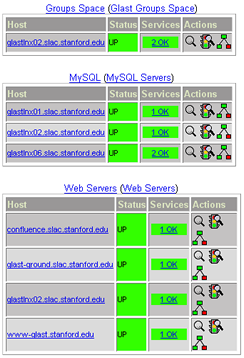
Note: If you are at SLAC, and wish to get a quick overview of the hosts and machines monitored by Nagios, view Service Status Details for all Service Groups.
 |
Nagios (available only if you are at SLAC )
|
 |
Things to Note:
|
| Note: If you prefer, you may wish to monitor the Servicegroup Summary page, or the Hostgroup Summary page instead of the respective Overview pages. | |
Troubleshooting Tips: Nagios Problem conditions are color-coded:
|
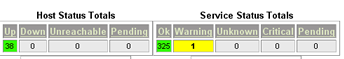 |
If there is an Outage, the Host Status "Up" box on the left will be red. Notes:
|
|
| If there is a Warning, a yellow warning link will be displayed in the host's Services column; click on this link to view the Status Information: | 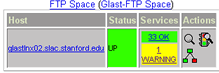 |
After reading the Status Information, click on the Host link in the left column (glastlnx02.slac.stanford.edu) to view a a list of all Services and disk space provided by the affected host, together with the Status, Last Check, Duration, Attempt, and Status Information for each.
Server Monitoring (Tomcat Servers)
|
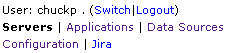 |
- In the upper right corner, click on: Configuration
The "Select Server Name" pane will be displayed.
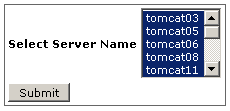
- With the "Shift" key depressed, scroll through the list and select all servers then, in the upper right corner, click on: Applications
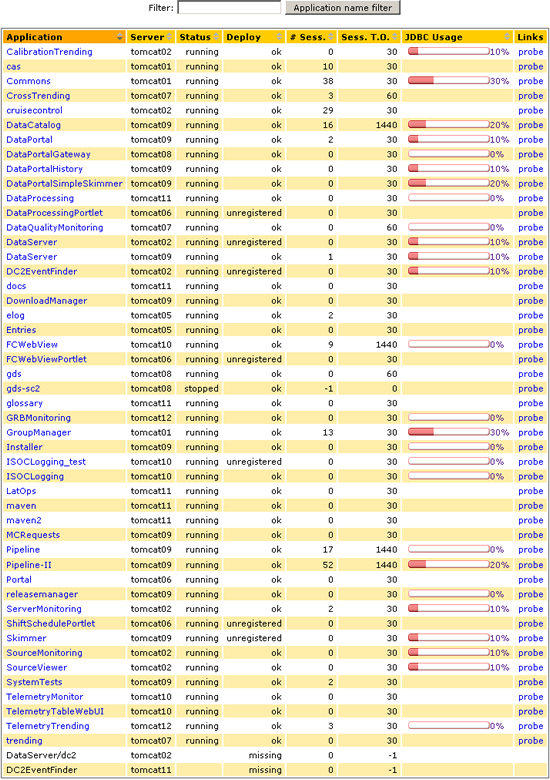
A page similar to the following will be displayed (note that there is a "Show all servers/Show prod servers" toggle in the top left corner of this page.:
Note: Applications shown were those running the day this was written. If an application has failed, refer to the Tomcat page in Confluence??????????????
Troubleshooting Resources
- Red Hat Enterprise Linux 3 System Administration Guide
- linux.troubleshooting.com
- Red Hat Enterprise Linux 4: Reference Guide
- NFS
- How to troubleshoot startup problems in Windows Server 2003
- How To Troubleshoot a Web Server in Windows Server 2003