Resource Monitors: Nagios, Server
Monitoring, & Ganglia
There are three primary monitoring tools for the Science Analysis Systems software infrastructure: Nagios (currently available only at SLAC), the tomcat Server Monitoring tool, and Ganglia (for monitoring glast domains, including: glast-oracle, glastlnx, nfs-glast, and glast-xrootd).
Note: If you are at SLAC, and wish to get a quick overview of the hosts and machines monitored by Nagios, view Service Status Details for all Service Groups.
 |
Nagios (available only if you are at SLAC )
- Launch Nagios.
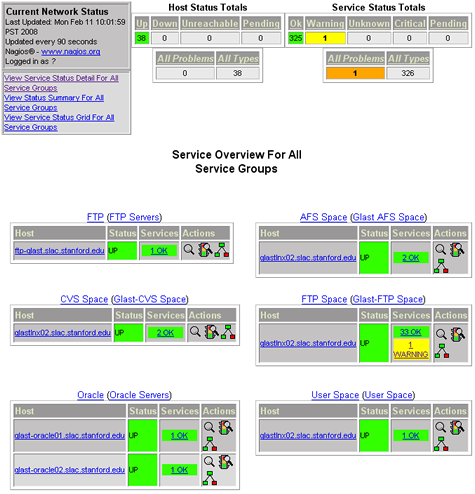
- From the menu, select: Servicegroup Overview to see an overview (similar to the following)for all service groups:
Note: If you prefer to can see an overview of Host Groups by Machine Types (e.g., RHEL3, RHEL4, Windows, isoc machines, isoc servers, isoc workstations, etc.), click on: Hostgroup Overview in the Nagios menu.
|
 |
Things to Note:
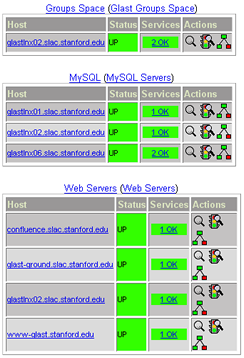
- Service Groups monitored are one of two types: Server or Space.
- Server groups monitored include:
- FTP Servers
- Oracle Servers
- MySQL Servers
- Web Servers
- Space groups monitored include:
- CVS Space
- AFS Space
- FTP Space
- User Space
- Groups Space
- Drilldown links are provided in both the "Host" and "Services" columns; links are also provided in upper left corner to Host "History", "Notifications" as well as "Service Status Detail for all Hosts".
|
| Note: If you prefer, you may wish to monitor the Servicegroup Summary page, or the Hostgroup Summary page instead of the respective Overview pages. |
Troubleshooting Tips: Nagios
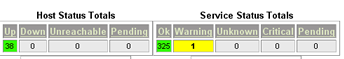
Problem conditions are color-coded:
- Red = Outage
- Yellow = Warning
|
|
If there is an Outage, the Host Status "Up" box on the left will be red.
Notes:
- If the host is on a local network (i.e., not connected to Nagios via a router), Nagios simply issues a 'host check" command and assumes the host is up if the command returns an OK state.
If the host returns any other status level, Nagios assumes the host is down.
- If the host is on a remote network, Nagios indicates if the Host is (from Nagios' point-of-view) Up, Down, or Unreachable (e.g., one or more routers connecting to the host is down).
See: Determining Status and Reachability of Network Hosts.
|
|