#1 How to Fix: in Confluence; except for "how to fix Confluence itself"
- Get list of services that may fail
o Pipeline
o AFS
o etc.
- Get recipe of how to fix each
???Tomcat Servers??? for develpers/testing only???
???xrootd???
- How to Fix: in Confluence; except for "how to fix Confluence itself"
- Get list of services that may fail
Tony's List (Confluence: How to Fix)
- Nagio
- FastCopy
- Pipeline
- AFS
- xrootd
- MySql
- CVS
- Java CVS
- SSH
- Release Manager???
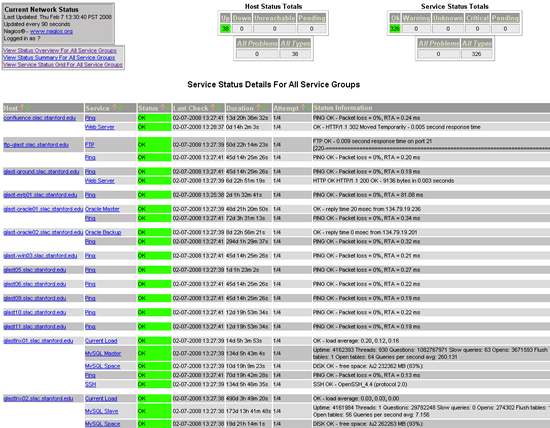
Nagios (Service Overview for
all Service Groups - live)
- FTP Servers
- FTP Space
- CVS Space
- Oracle Servers
- AFS Space
- User Space
- Groups Space
- MySQL Servers
- Web Servers (confluece.slac.stanford.edu, glast-ground.slac.stanford.edu, glastlnx02.slac.stanford.edu, glast.stanford.edu)
Note: On Service Overview for all Host Groups, you will find the following:
- "isoc-machines", "isoc-servers", "isoc-workstations";
- "all" machines, "RHEL3" RedHat Enterprise Linux 3, and "RHEL4" Machines and "Windows" 2003 Machines
Troubleshooting Resources:
- Red Hat Enterprise Linux 3 System Administration Guide
- linux.troubleshooting.com
- Red Hat Enterprise Linux 4: Reference Guide
- NFS
- How to troubleshoot startup problems in Windows Server 2003
- How To Troubleshoot a Web Server in Windows Server 2003
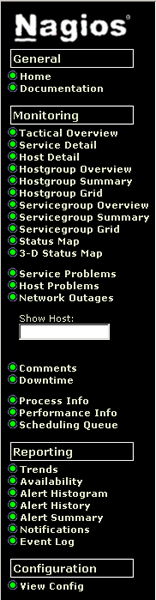 |
Nagios (available only if you are at SLAC )
Troubleshooting Tip:
|
|
|
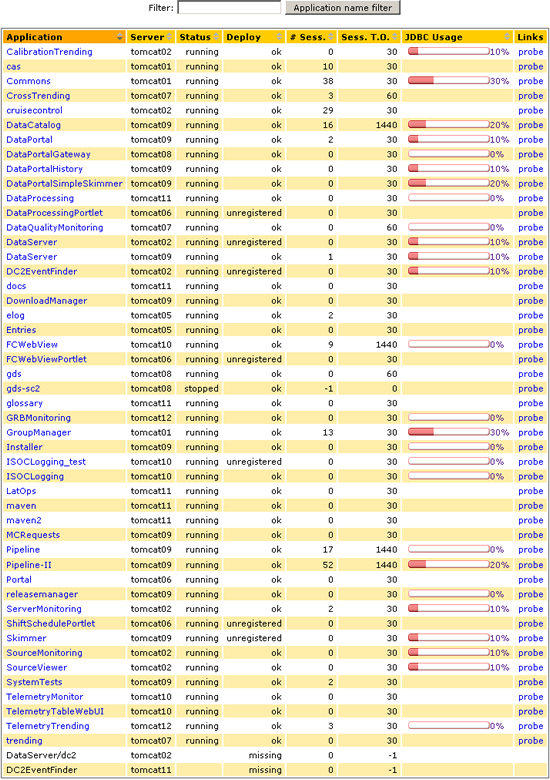
Tomcat Servers
- To view the applications running on Tomcat servers, click on: Server Monitoring
The Server Monitoring page will be displayed.
- In the upper right corner, click on: Configuration
The "Select Server Name" pane will be displayed.
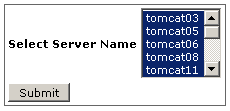
- With the "Shift" key depressed, scroll through the list and select all servers then, in the upper right corner, click on: Applications
A page similar to the following will be displayed (note that there is a "Show all servers/Show prod servers" toggle in the top left corner of this page.:
Note: Applications shown were those running the day this was written. If an application has failed, refer to the Tomcat page in Confluence??????????????